To truly understand Bitcoin’s current position, you need to look at three layers simultaneously:
macro conditions, capital flows, and the U.S. stock market.
Right now, these signals paint a picture of:
👉 “moderate improvement — but no strong confirmation yet.”
⚡️ 1. Macro: Pressure Is Easing — Not Gone
The U.S. Financial Conditions Index, after weeks of tightening (meaning liquidity was harder to access), has likely peaked and is now turning.
What matters most here is not the level — but the direction.
Interpretation:
Systemic pressure on risk assets is decreasing
But we’re NOT in a full risk-on environment yet
Leverage in the system is still relatively contained
👉 Translation: Conditions are improving… but not bullish enough for full confidence.
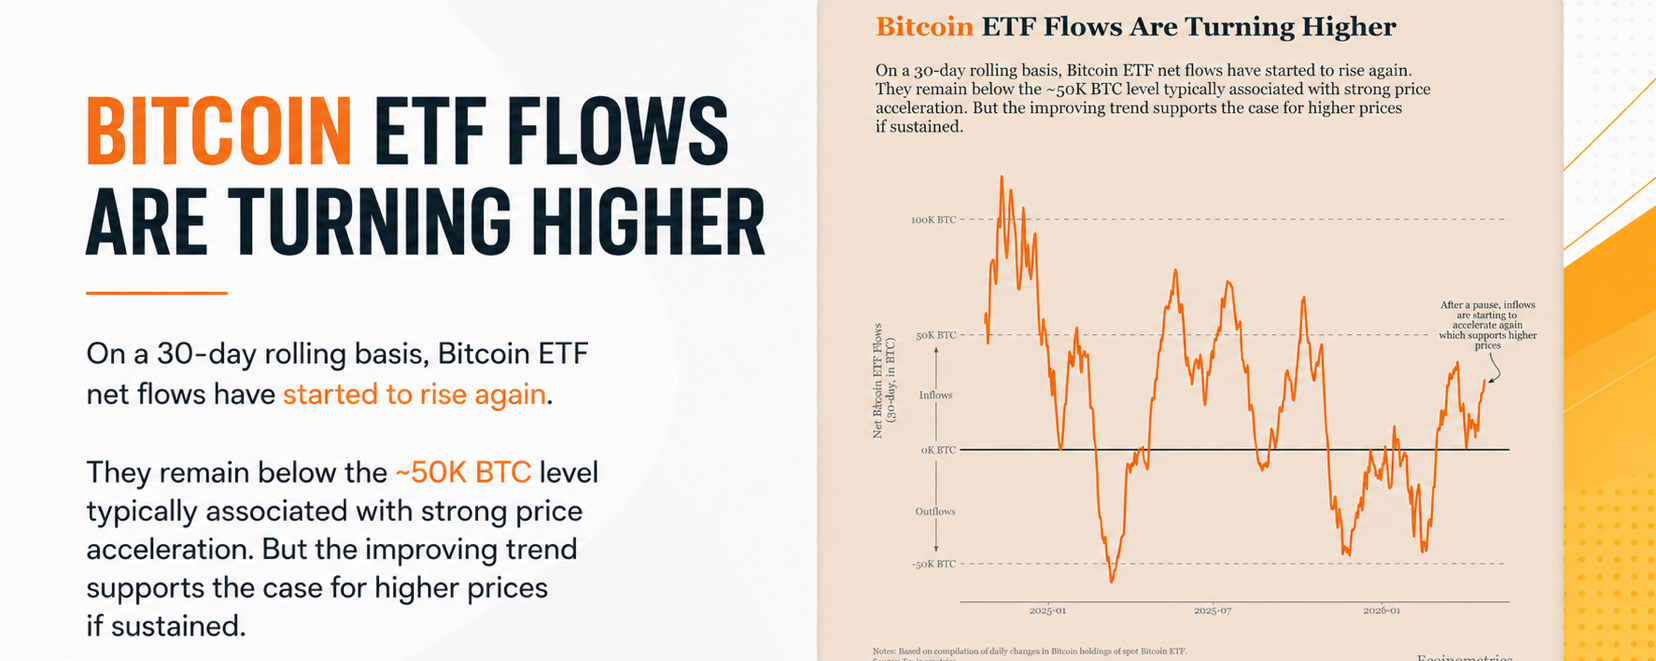
⚡️ 2. Capital Flows: Demand Is Back — But Not Strong Enough
ETF inflows have turned positive again — a sign the market is moving out of its correction phaser
However, there’s a critical threshold:
📊 ~50,000 $BTC inflows over 30 days
Below this level → price can rise, but sustainability is weak
Above this level → stronger, more reliable trends
👉 Right now? We’re in the gray zone:
Demand is improving, but still lacks conviction.
⚡️ 3. Stocks: New Highs — Weak Breadth
Major indices like S&P 500 and NASDAQ Composite are hitting new highs…
But here’s the catch:
Only ~55% of stocks are above their 200-day moving average.
📊 Healthy market = 65–75%
👉 This means:
The rally is driven by a limited number of stocks
Market breadth is weak
Any negative signal could trigger faster pullbacks
And since Bitcoin still correlates with risk assets, this directly impacts $BTC.
📣 Final Take
🔻 No position? → Scale in gradually
🔻 Already in? → Increasing risk here isn’t strongly justified
👉 The market is improving…
But we’re still waiting for real confirmation.
Source: Ecoinometrics