

Brothers, good late night! Just now, the market dynamics shifted dramatically, and the bulls faced an extremely brutal precision strike! #BTC $BTC

The current price is firmly pressed in the 76,750 range. Setting aside the market's panic noise, let's dive straight into the hardcore market breakdown, tonight's turning point is right here, let’s seize it!
🔥 Latest Market Situation Deep Dive (Hitting the Main Player's Cards)
1-Hour Level Guillotine: Keep an eye on this 1-hour chart, the market is extremely bloody! Bitcoin struggled around 77,800, and suddenly a large candlestick with high volume slammed down, instantly breaking through the short-term support box, with a low wick probing down to around 76,532. This reckless one-sided sell-off indicates severe liquidation of trapped positions and profit-takers, with short-term sentiment hitting rock bottom.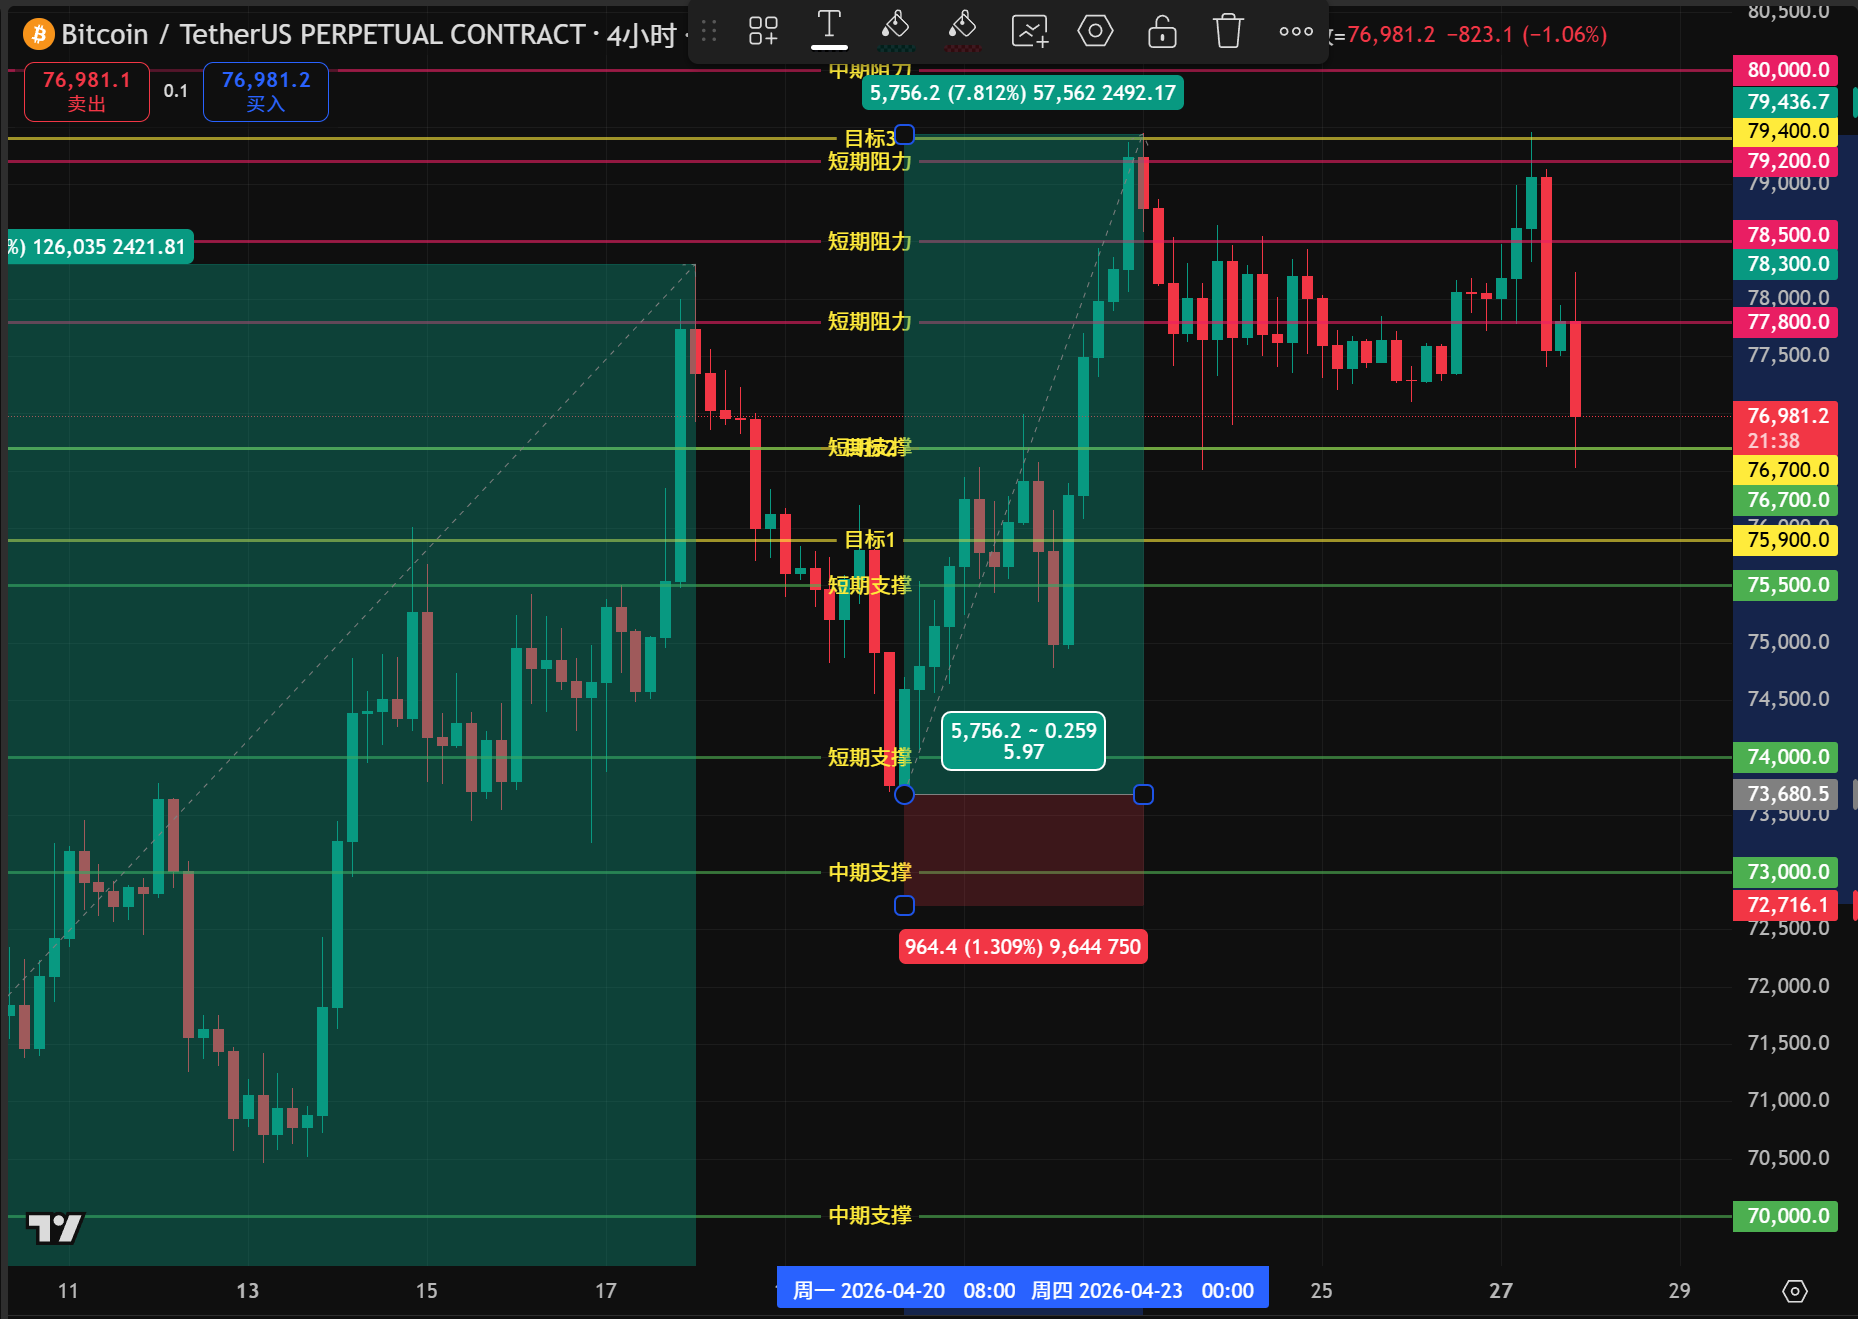
4-hour double top is in play: Zooming into the 4-hour chart, the situation is clearer. Bitcoin has failed twice at the 79,000 resistance level, forming a massive 'M-top' pattern. The price is currently accelerating towards the neckline, and this pullback is a violent correction of the previous extreme short squeeze.
Stabilize the market sentiment (fighting for the 126,000 big top): Is the short-term drop giving you a headache? Open up the macro view! The ultimate high point of this bull market is around 126,000. Before reaching the 80,000 threshold, the main players must wash out the high leverage positions through several thousand points of intense volatility. Avoid emotional trades on falling knives, and strictly execute right-side support limit orders!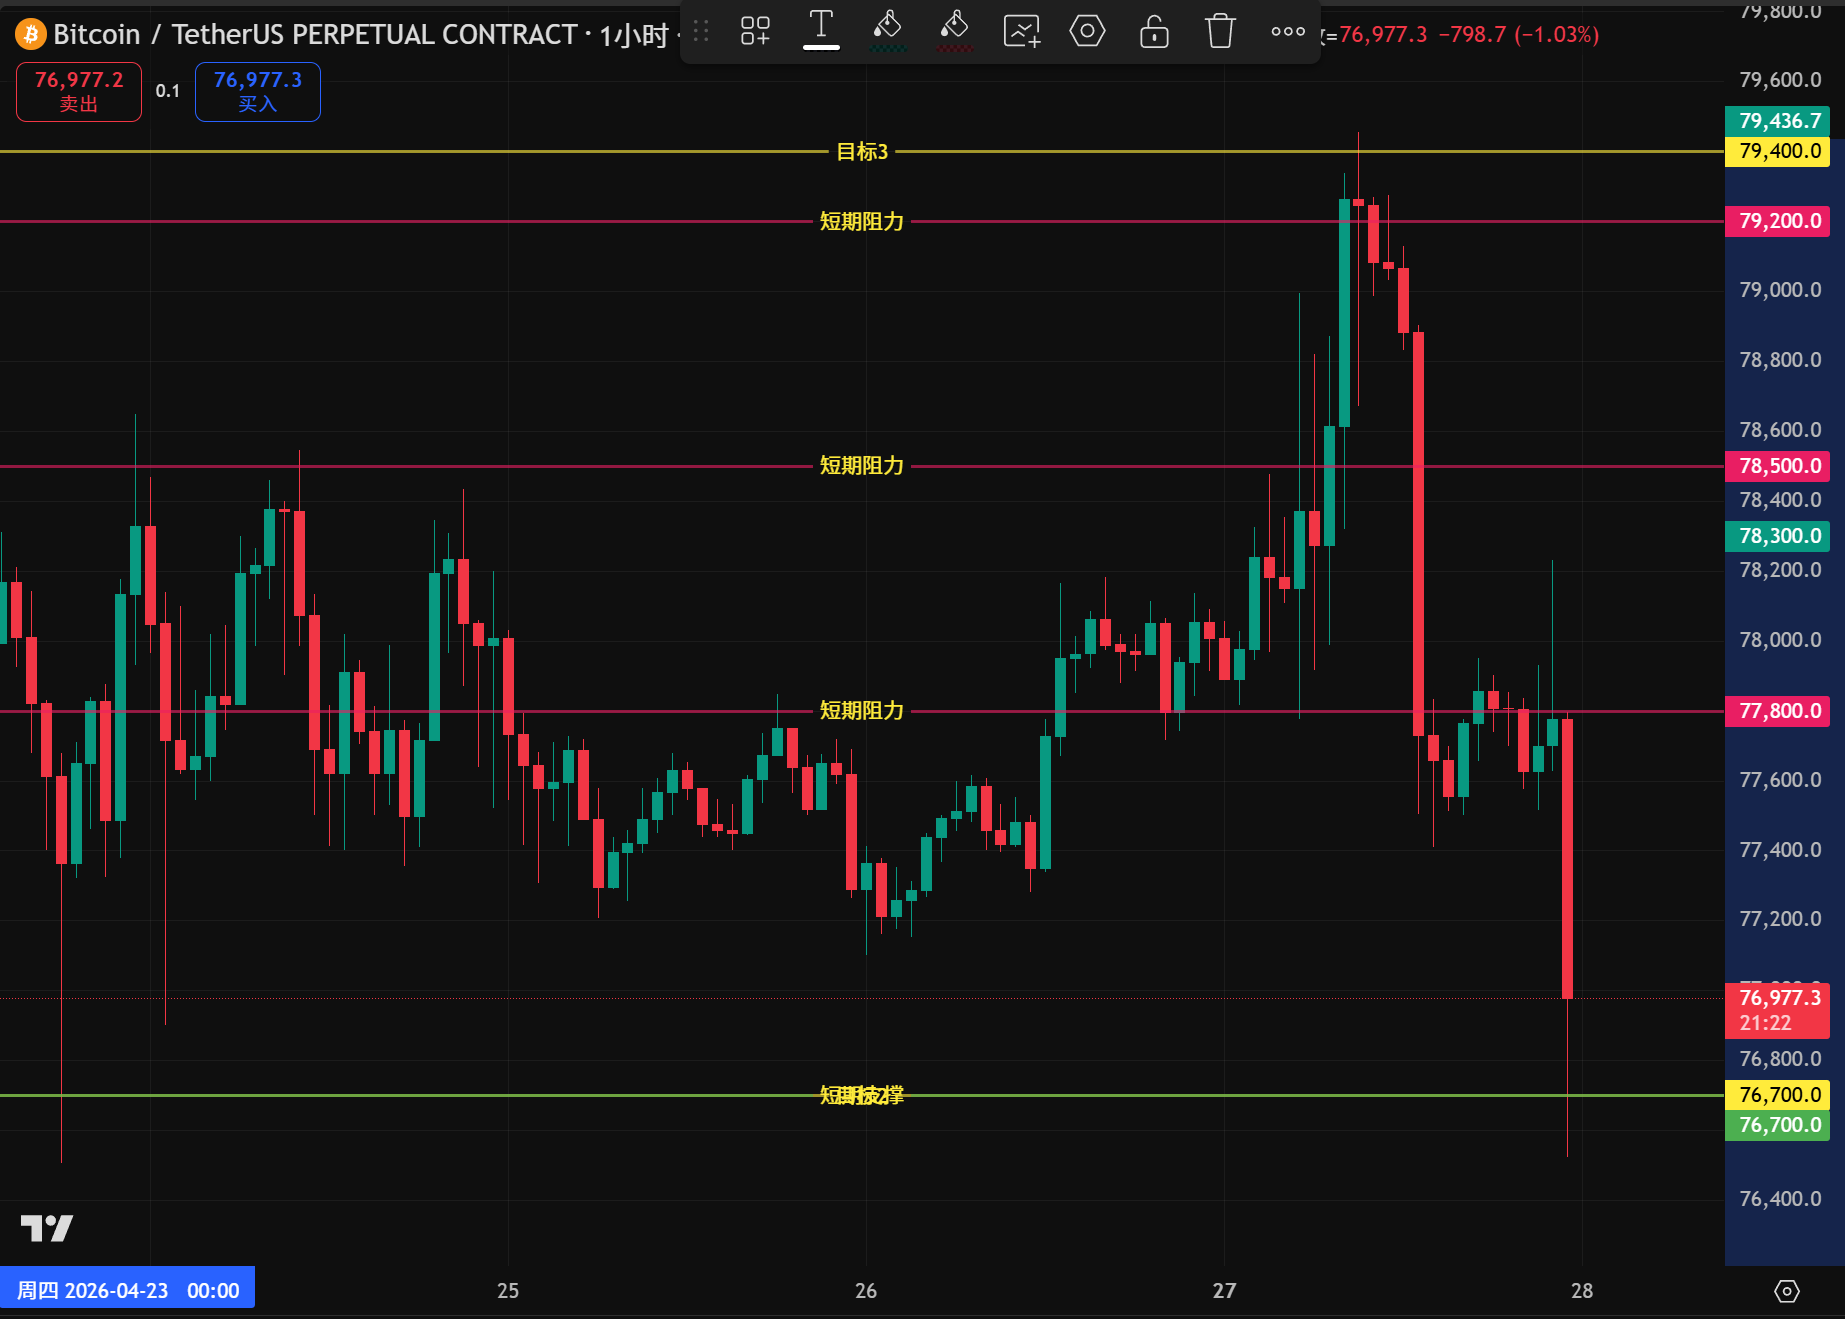
1. Support and resistance levels (midnight precision version)
🟢 Short-term support (1-3 days, looking for panic extremes intraday)
76,700: Immediate support. This large bearish candle just created a bloody spike on the 1-hour chart, the primary testing point for the bears today.
75,500: Strong support. The central point of a major upward wave pullback on the 4-hour chart, with extremely strong buying consensus.
74,000: Core support. The top area of the previous wide-range consolidation box; a break below this could trigger deep panic.
🔵 Medium-term support (1-2 weeks, area for swing accumulation)
73,000: The previous area of intensive trading with strong consensus.
70,000: A major psychological level, the dividing line of bulls and bears.
67,000: The launch pad for this one-sided short squeeze.
🔴 Short-term resistance (1-3 days, high-pressure pullback zone)
77,800: Immediate resistance (top-bottom conversion). Just violently broken through the bottom of the 1-hour consolidation platform, now it becomes the first ghost gate for the pullback.
78,500: Strong resistance. The high point of the right shoulder on the 4-hour chart before the drop, trapping a lot of bottom-fishing long positions.
79,200: Core resistance. An absolute historical peak that requires a massive influx of capital to break through in the short term.
🟠 Medium-term resistance (aiming for the 126,000 holy grail)
80,000: An epic psychological milestone.
84,000: The first macro expansion target for the second half of the bull market.
126,000: Macro historical top (ultimate big BOSS).