
A Bitcoin miner health indicator that compares the 30-day and 60-day moving averages of network hashrate has fired a buy signal following a period of hashrate stress.
Key Takeaways
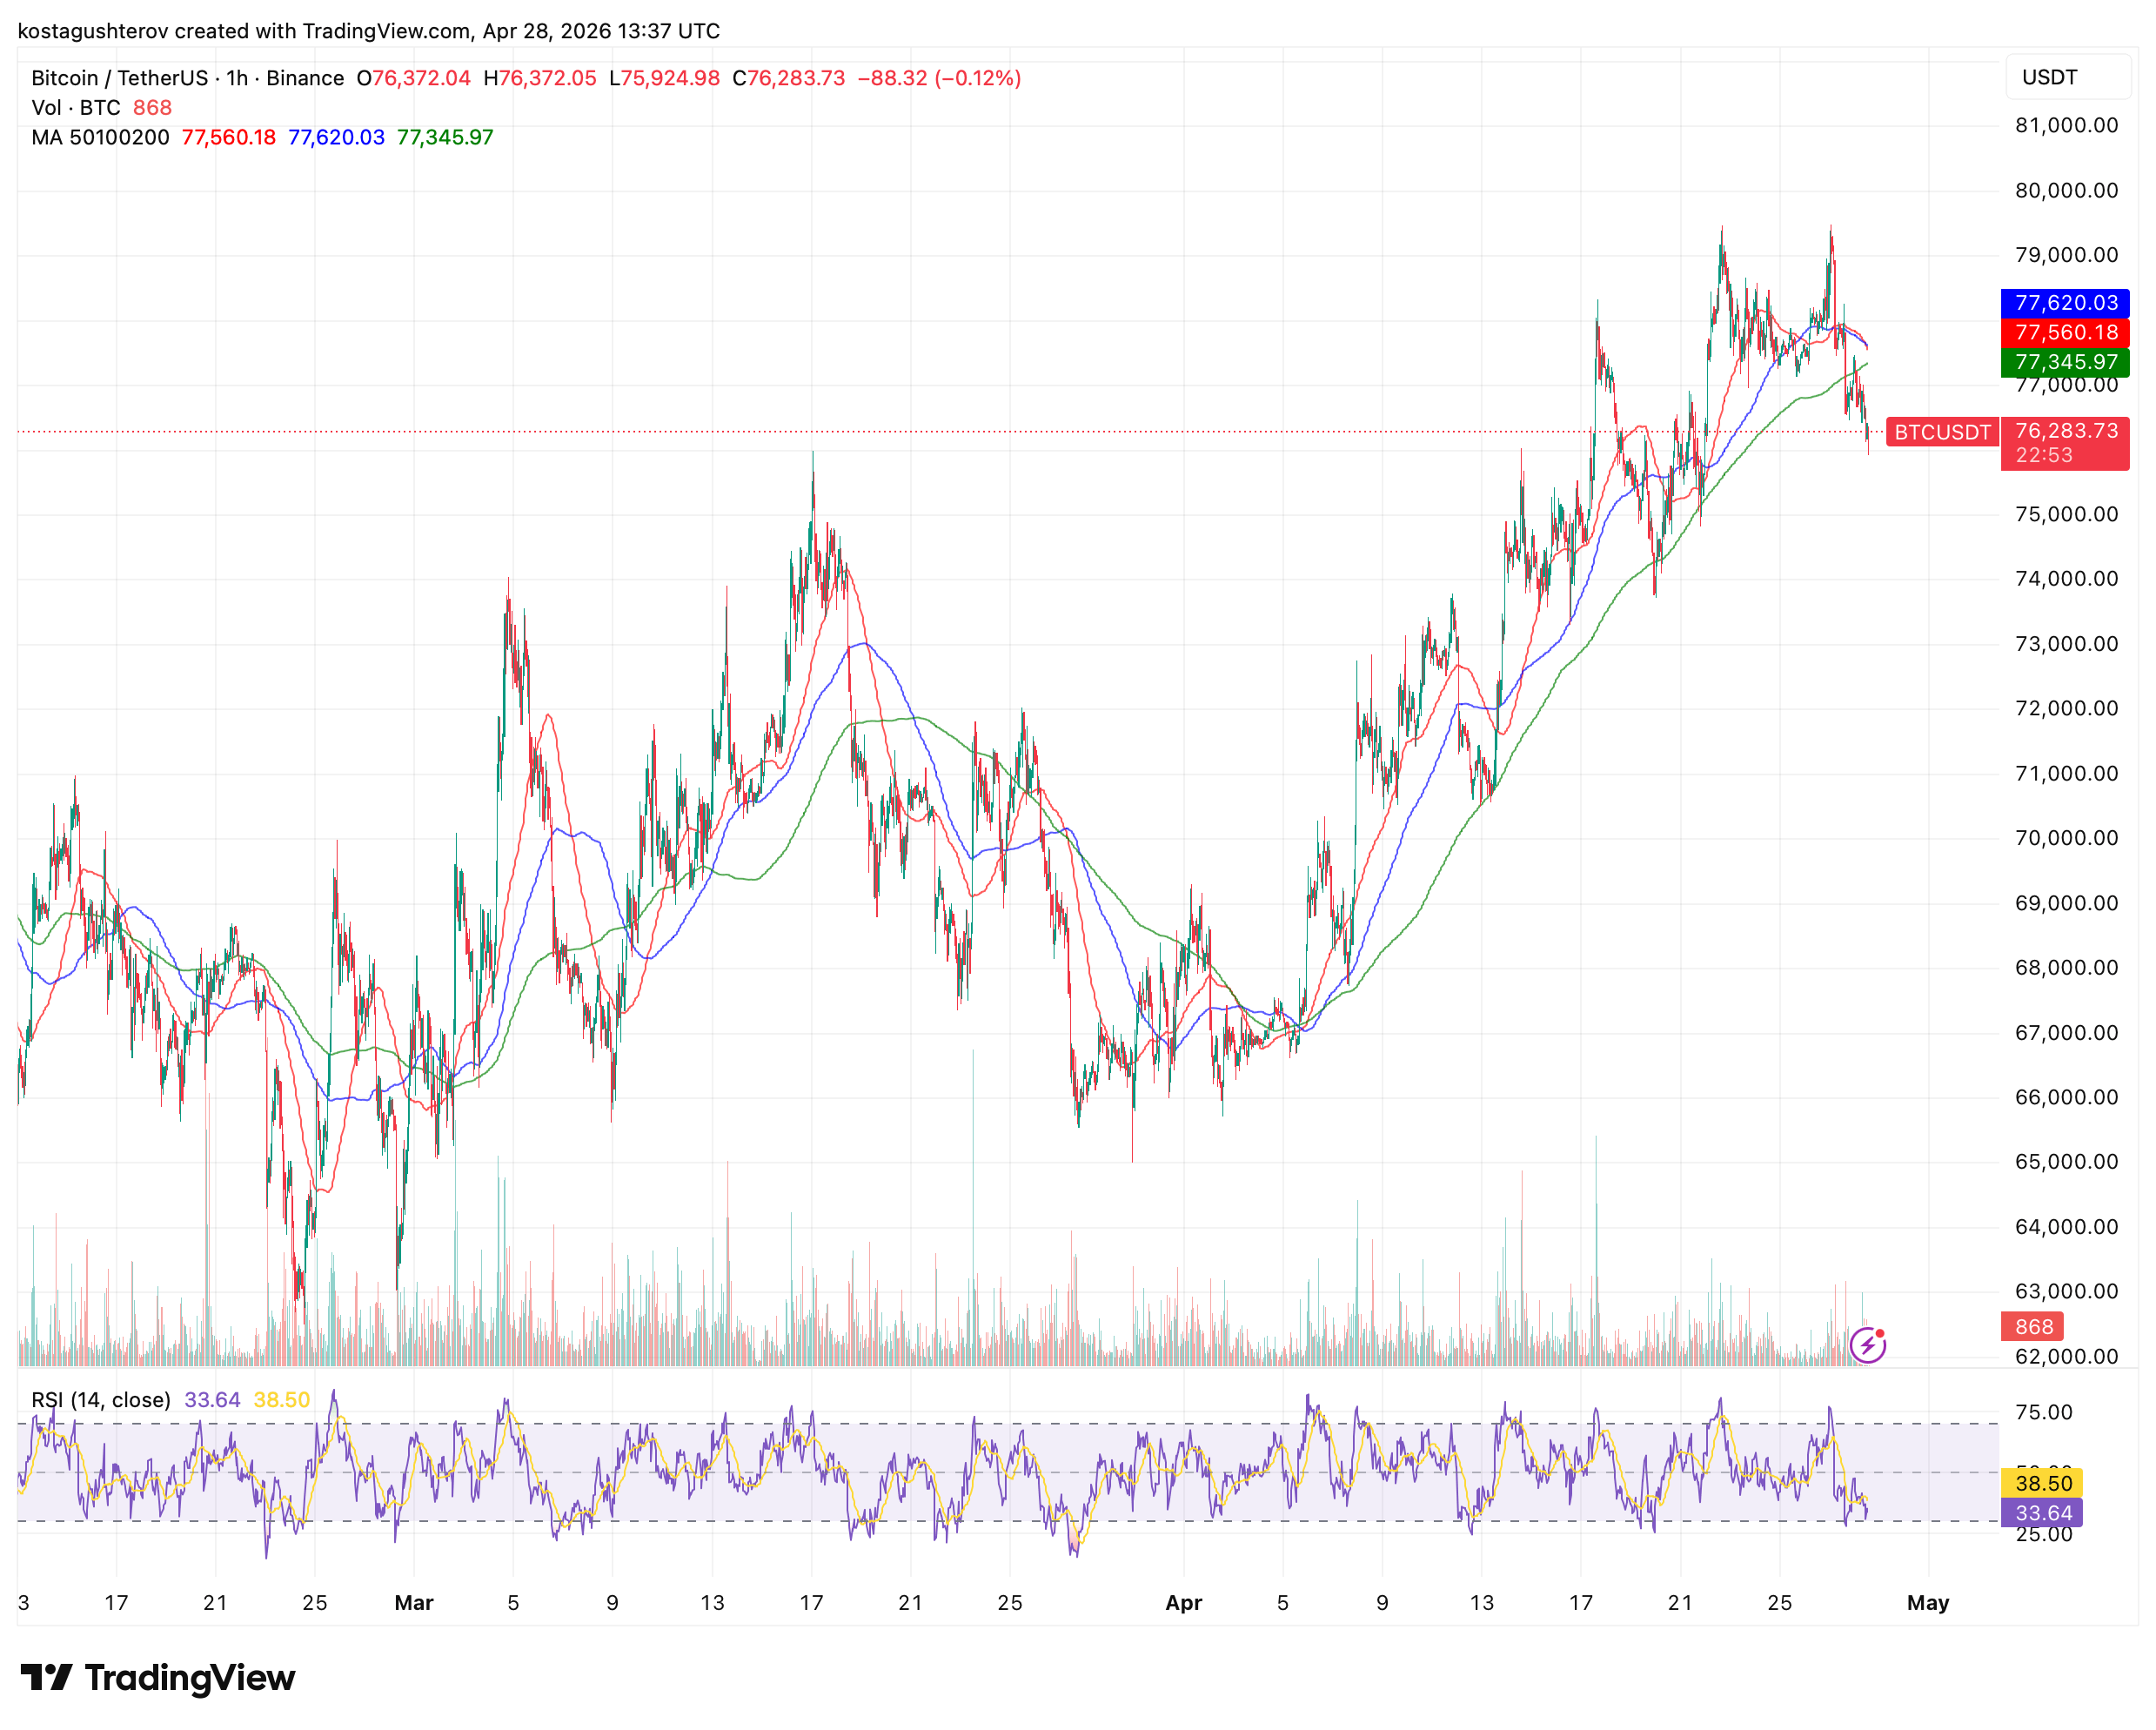
BTC price: $76,352, below 50MA, 100MA, 200MA.
RSI(14): 34.45 on faster signal, in oversold territory.
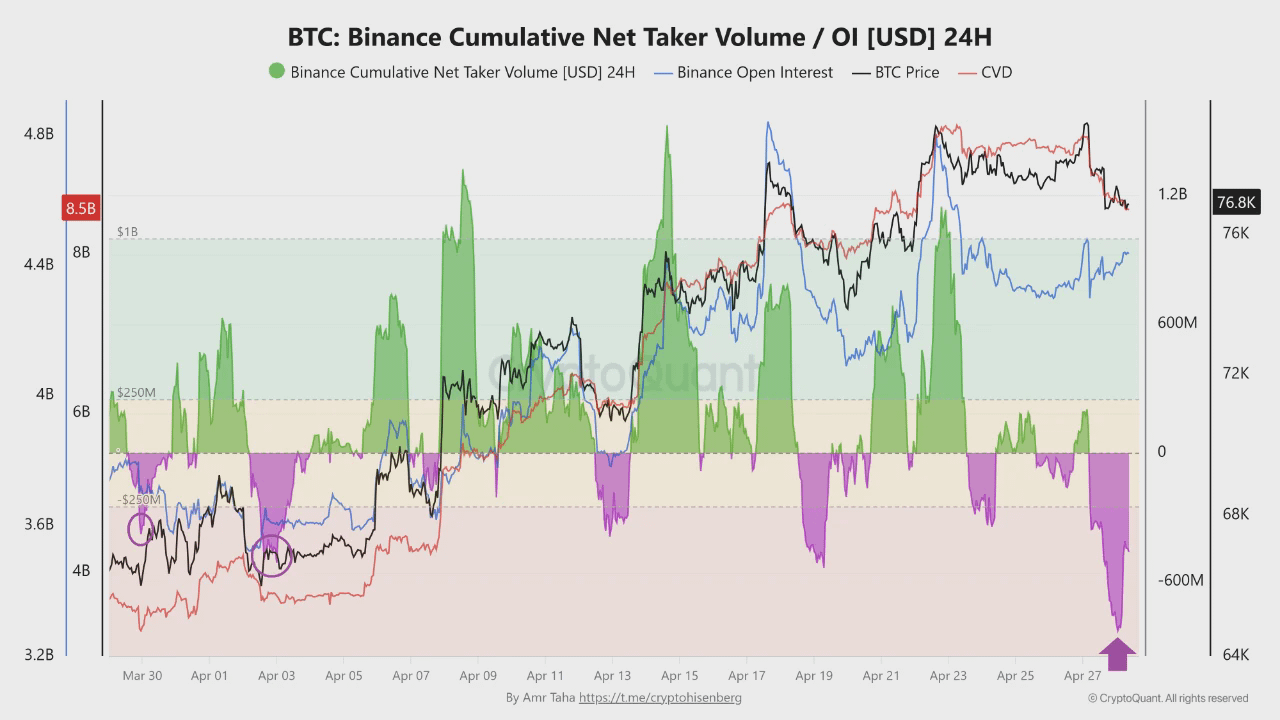
Binance net taker volume: -$828M, deepest since late March.
Taker buy/sell ratio: 0.899, matching March 29 exhaustion level.
Miner stress indicator: buy signal active as 30d hashrate MA crossed above 60.
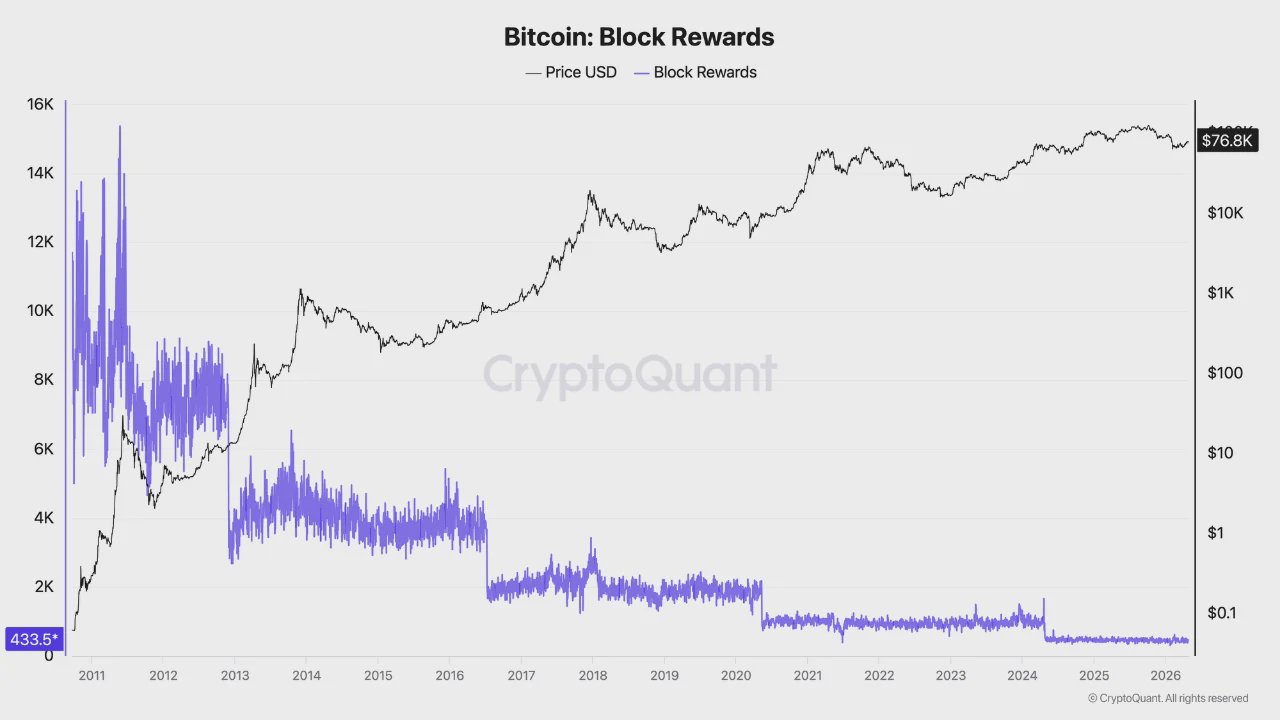
Daily block reward revenue: $33.6M, down from $100M+ at 2024 peak.
Three prior false signals: 2026 US ice storm, June 2022, China ban 2021.
Open interest: elevated at $1.1B to $1.2B during the taker volume selloff.
According to CryptoQuant report, the same indicator misfired on the 2026 US ice storm, the June 2022 sell-off, and the 2021 China mining ban. Binance net taker volume sits at -$828M and RSI has reached 34.45. The price signals are converging toward exhaustion. Whether miners are genuinely recovering or normalizing after an external disruption is the question the indicator cannot answer, and the one that determines whether this signal means anything.
When The Indicator Fires On Weather
The miner stress indicator (Hash ribbons) triggers a buy signal when the short-term hashrate average crosses back above the long-term average after a period of compression, the moment miner recovery begins after genuine capitulation.
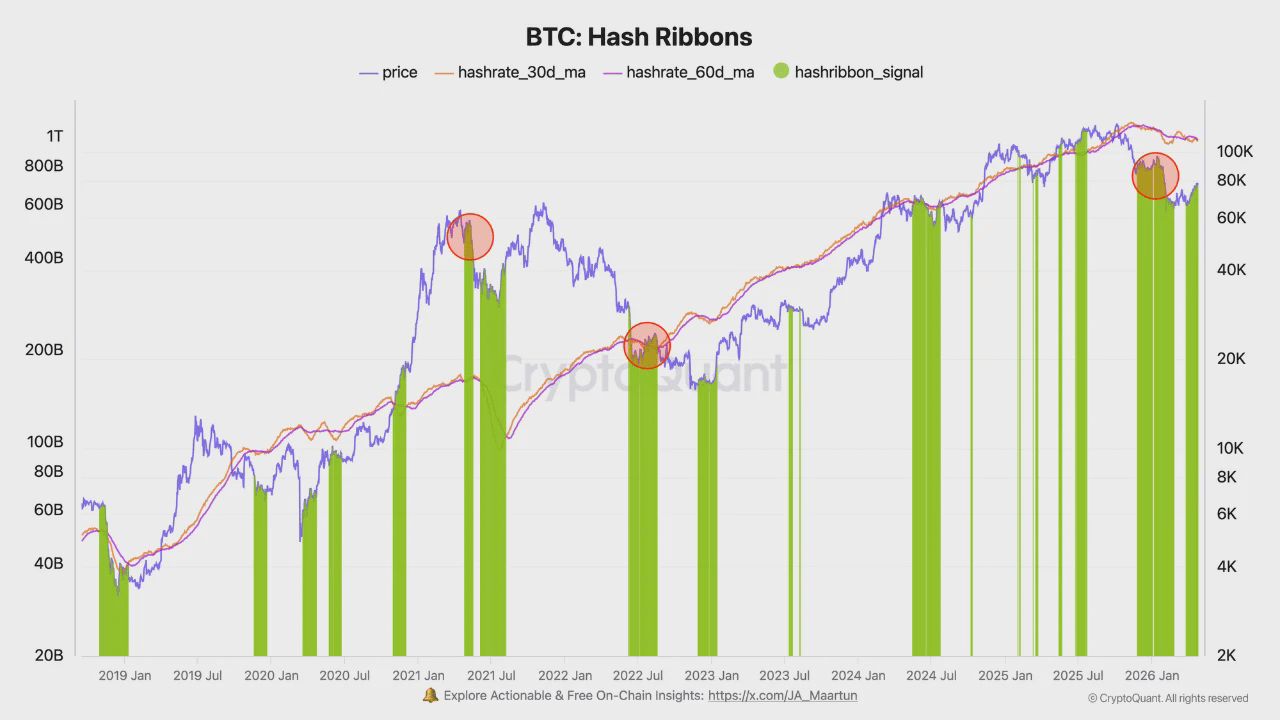
The 2026 US ice storm exposed its structural limit. North American mining facilities shut down temporarily, hashrate fell, the short-term average dropped below the long-term, and when temperatures normalized, hashrate recovered and the signal fired. No miners had capitulated on economics. No difficulty reset had cleared unprofitable operations from the network. A meteorological event produced an identical hashrate signature to a genuine mining cycle bottom, and the indicator cannot distinguish between them because it measures averages, not causes.
The China ban in 2021 and the June 2022 period produced the same misread through different mechanisms. In 2021, forced relocation created a temporary hashrate collapse that resolved when miners re-established operations abroad. In June 2022, cascading market stress caused a sharp but short-lived hashrate disruption that normalized before any meaningful economic capitulation occurred. Three false signals in four years is not a track record problem. It is a design problem: the indicator was built for a world where hashrate disruptions were primarily economic. The current signal is ambiguous for the same reason the ice storm signal was: there is no public confirmation yet of whether the recent hashrate stress was driven by profitability pressure or an external disruption. Until that is known, the signal is a question, not an answer.
The Margin That Makes Every Signal Harder To Read
At 3.125 BTC per block and $76,800 price, miners collectively earn approximately $33.6M per day in block rewards before costs. At the 2024 cycle peak that figure exceeded $100M per day. Two-thirds of peak reward revenue has been removed by the halving while energy costs, equipment financing, and infrastructure overhead have not adjusted proportionally.
Compressed margins change the signal environment in one specific way: a miner at $33.6M daily network revenue who goes offline temporarily due to an external disruption is already operating close enough to the profitability threshold that the indicator cannot separate their hashrate signature from genuine capitulation. In 2021, a miner earning multiples of today's reward who shut down due to the China ban had an obvious economic incentive to return, the hashrate collapse was deep and sustained because relocation took months and the reward justified the cost. At current revenue levels, the gap between a miner who is temporarily disrupted and one who has genuinely capitulated on economics has narrowed to the point where both produce the same short-term hashrate shape. The indicator sees the same curve. The cause underneath is different. And at these margins, the next external disruption that produces an identical signature is not a tail risk. It is a base case.
One Pullback, Three Measurements, One Signal
RSI at 34.45, Binance net taker volume at -$828M, and price below a compressed MA cluster at $77,335 to $77,632 are not three independent buy signals. They are the same signal, a 4.3% pullback from the April 24 peak of $79,800, expressed in three different metrics simultaneously. Read as one signal they are informative. Read as three independent confirmations they overstate the case. A sharp short-term selloff produces all three conditions by definition, and treating their convergence as unusual overstates the evidence for a recovery.
The March 29 comparable is the strongest single data point for the exhaustion reading. On that date the taker buy/sell ratio hit 0.899, matching today's level exactly, RSI and the MA structure were similarly depressed, and all three metrics bottomed together as they are doing now, consistent with the single-pullback reading.
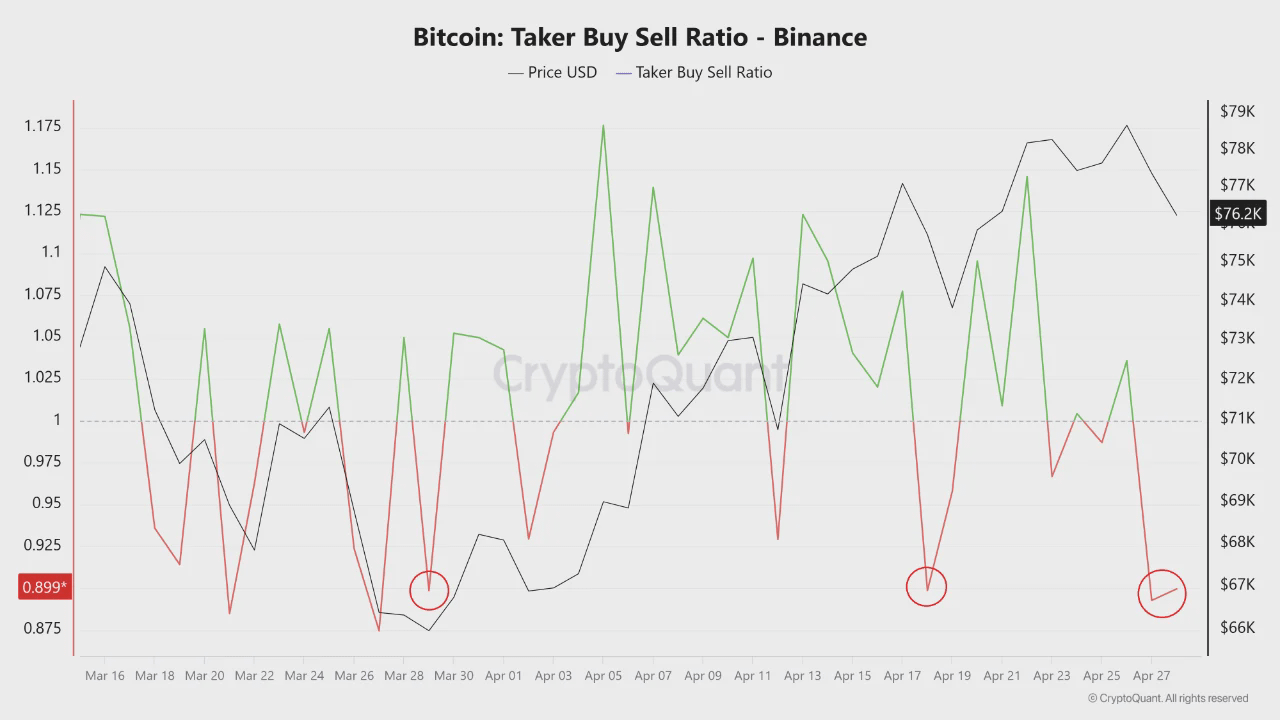
Bitcoin was above $66,000 and price subsequently recovered. The gap between then and now is open interest, sitting at approximately $1.1B to $1.2B today versus a materially lower level on March 29. Elevated OI does not change the exhaustion reading. It changes the recovery path. A clean bounce requires the OI to be absorbed rather than liquidated, and that distinction will be visible in whether taker volume normalizes above -$200M within 72 hours or remains negative as price attempts to recover.
The Only Clock That Matters Right Now
The miner signal and the price signals do not resolve on parallel timescales. They resolve sequentially, and the price signal resolves first. A daily close above $77,632, the 100MA, within 72 hours with net taker volume recovering above -$200M confirms the selloff has absorbed and the OI overhang is being held rather than unwound. That is the confirmation signal for the exhaustion reading, and it arrives before any miner data can meaningfully update. The denial signal is a close below $75,000 with OI remaining elevated above $1.1B, indicating leveraged positions are liquidating rather than holding and the March 29 comparison breaks down.
The miner signal cannot provide confirmation here, not because the indicator is broken, but because it cannot distinguish the condition that would make it meaningful from the condition that would make it noise. The question of whether the hashrate stress was economic or external will remain open regardless of price action. It is not a question the market resolves. It is a question the next disruption answers. The MA cluster at $77,632 is the only number that matters in the next three days