Market Overview
The $BNB BNB/USDT pair is currently trading at 622.90 USDT, showing a slight gain of +0.03%. Price movement over the past 24 hours has remained within a tight range, with a high of 627.58 USDT and a low of 619.00 USDT, indicating controlled volatility and consolidation.
Technical Indicators
MA(60): 622.60 — Price is trading very close to this level, suggesting equilibrium.
Short-Term MAs (5 & 10): Indicate mild bearish pressure after a recent upward move.
Volume: Mixed signals, showing indecision between buyers and sellers.
Market Structure
The chart reflects a short-term bullish push followed by a pullback. Price is now stabilizing, forming a potential consolidation zone before the next move.
Trading Signal
Bias: Neutral to Slightly Bullish
Buy Scenario (Long Entry)
Entry Zone: 622 – 623 USDT
Target 1: 625 USDT
Target 2: 628 USDT
Stop Loss: 619 USDT
👉 Confirmation: Enter only if price holds above 622 with increasing volume.
Sell Scenario (Short Entry)
Entry Zone: Below 621 USDT
Target 1: 619 USDT
Target 2: 615 USDT
Stop Loss: 624 USDT
👉 Confirmation: Enter if price breaks support with strong selling pressure.
Conclusion
The market is currently in a consolidation phase. Traders should wait for a clear breakout or breakdown before taking strong positions. Risk management is essential due to low volatility and uncertain direction.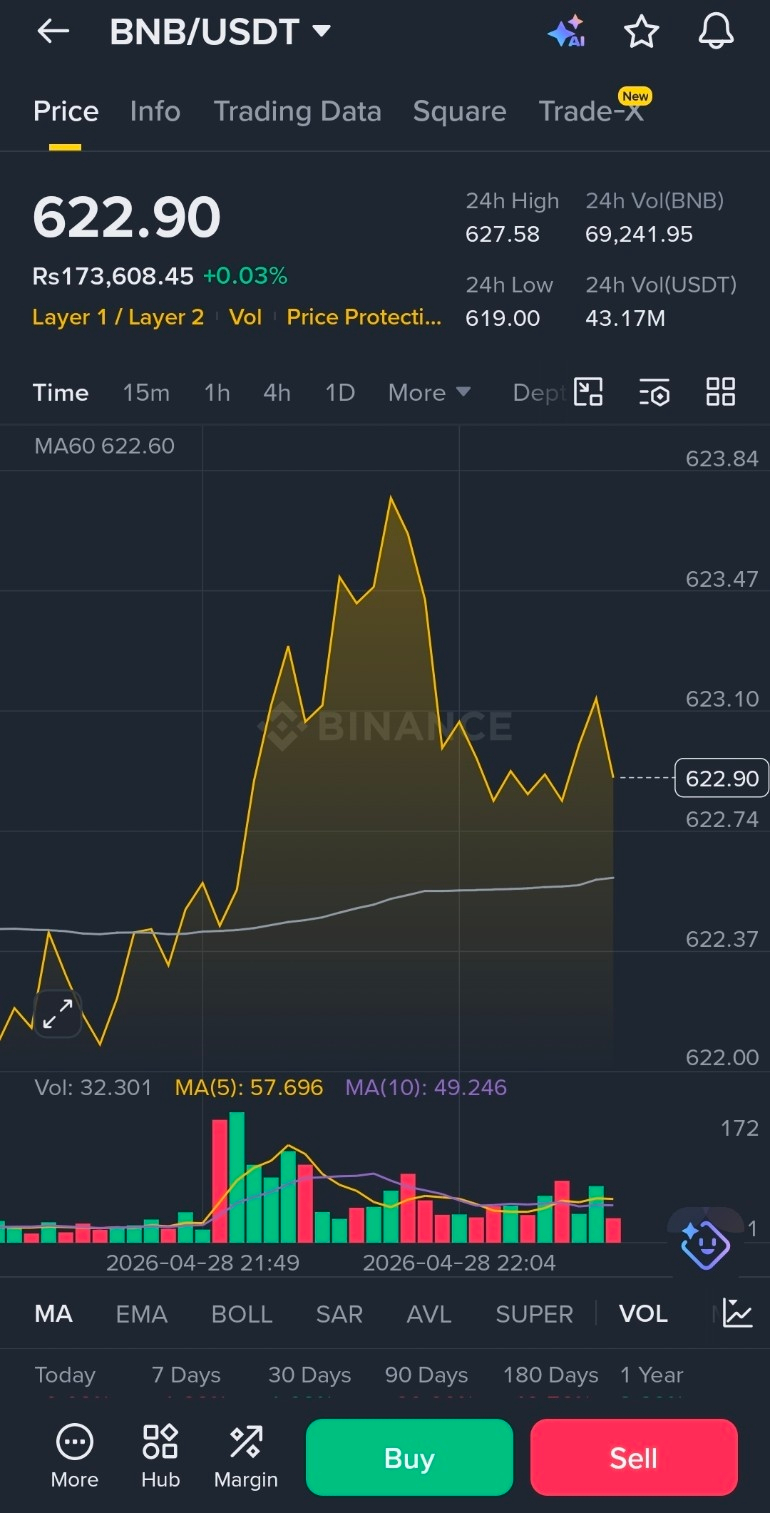
#BinanceLaunchesGoldvs.BTCTradingCompetition #BNB走势 #BNB_Market_Update