A key technical indicator in the XRP chart is conveying critical signals about the continuation of its price trend. The Relative Strength Index (RSI), an important tool for measuring market momentum, is currently rising in sync with the price. Notable XRP analyst EGRAG CRYPTO pointed out that this phenomenon confirms the bullish market in the current phase.
In his latest social media analysis, he emphasized that the coordinated rise between price and RSI reflects a healthy upward trend, indicating that buyer strength still dominates the market.
RSI pattern demonstrates robust market momentum
EGRAG CRYPTO particularly points out that when the price and RSI concurrently reach higher highs, it is one of the most convincing signals for judging trend health. This situation indicates that the bulls firmly control the market rhythm, and there are no signs of overheating in the current market. He further explains that the simultaneous rise of price and RSI indicates that the upward trend has genuine momentum support, which sharply contrasts with the bearish divergence pattern—where the price reaches new highs while the RSI weakens, often signaling trend exhaustion and an approaching adjustment.
In the chart data presented, the RSI curve shows a stable upward slope of approximately 9.32 degrees, aligning with XRP's gradual price increase over the past year. This coordinated trend characteristic suggests that the current trend is sustainable, supported by substantial market participation rather than short-term speculative behavior.
Key technical level breakthrough confirms long-term trend
According to the long-term chart drawn by EGRAG CRYPTO, XRP has successfully broken through the mid-channel of an ascending parallel channel that has lasted for many years. The baseline trend line of this channel can be traced back to 2014, and this effective breakthrough of the resistance line shows bullish momentum comparable to the major rebound from 2017 to 2018.
At the same time, the yellow moving average line representing the medium to long-term trend maintains an upward posture below the candlestick, forming a dynamic support line. This technical resonation reflects a significant improvement in the XRP market structure compared to the bearish phase from 2022 to mid-2024.
XRP future trend projection
EGRAG CRYPTO identifies $2.07 as the key support line and sets $3.65 (corresponding to the historical high in July 2025) as the recent target. Their analysis points out that the mutual verification of price structure and RSI indicators significantly reduces the probability of a sudden reversal in the market. Currently, there are no signs of bearish divergence, indicating that this upward trend still has room for continuation rather than nearing its end.
If XRP can consistently maintain above the breakout area of the mid-channel, the possibility of moving towards the target of $3.65 will significantly increase. As long as the price remains steadily above the support area of $2.07 and $2.50, the overall bullish pattern will remain intact, and the RSI momentum indicator will continue to support the bullish market.
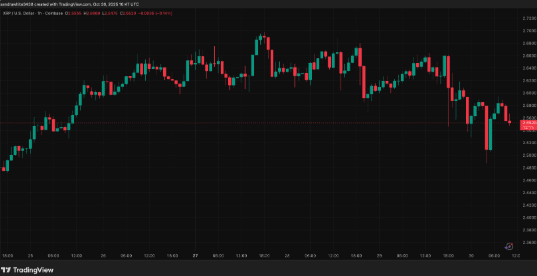
As of the time of writing, XRP is quoted at $2.58, slightly retreating from the daily high of $2.66. Recent trading data shows that this cryptocurrency is continuously attempting to reclaim the integer level of $2.60.