
While panic emotions dominate the majority due to the consecutive red Ethereum $ETH closures, the chart shows "calm" details indicating we're facing an accumulation opportunity, not a crash.
Why do I see Ethereum still holding strong?
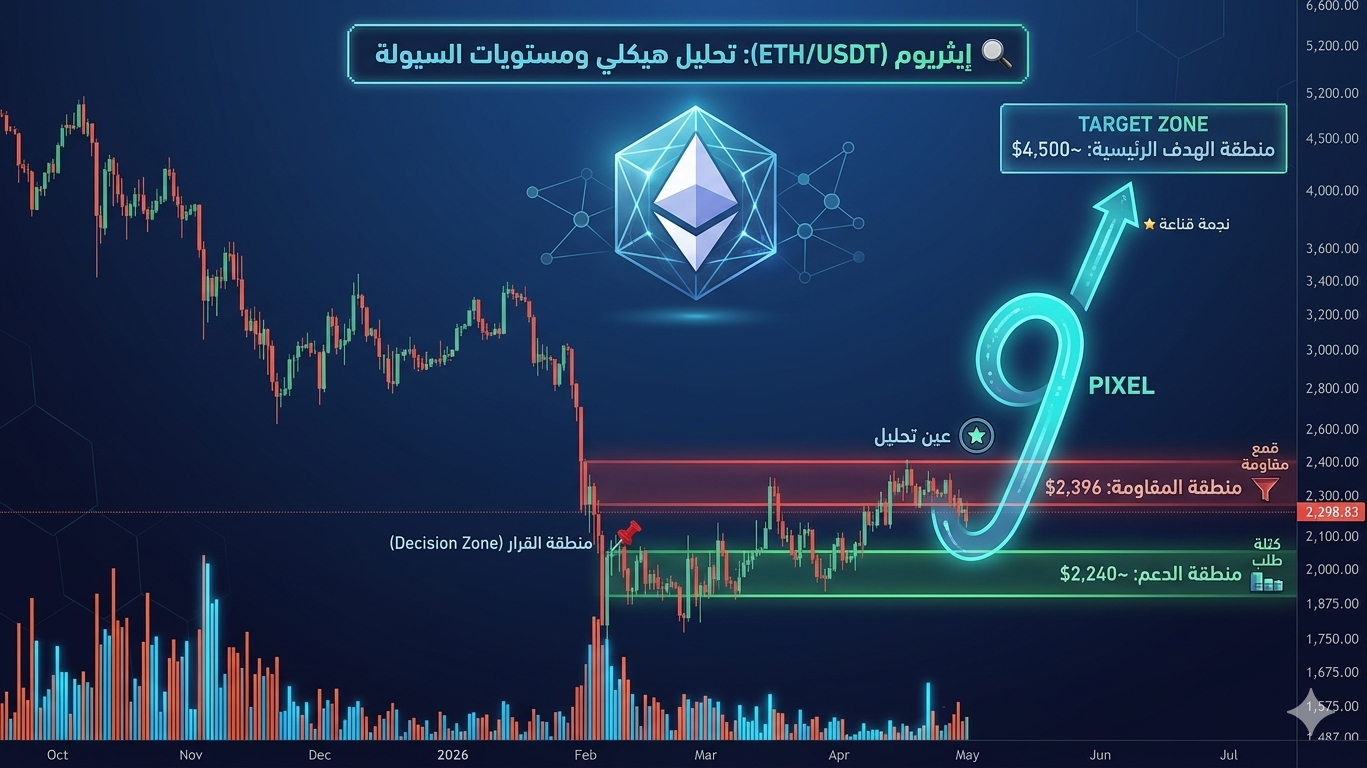
- Failed serial crash: even though it's been 12 days since the double top at $2,464, the price hasn't fallen into the "accelerated bleeding" trap. In bear markets, momentum increases over time, but in $ETH we see a boring sideways resistance, technically known as absorption.
- Previous cycle stats: Since February, the retracement waves have taken 13 to 16 days before they explode upwards. We’re currently on day 12; meaning we are in the final meters of the "time range" for the correction.
- Altcoin messages: The positive movement of small and mid caps can only happen if "smart money" is confident in the stability of the leaders ($BTC & $ETH). Altcoins are the "thermometer" that confirms the overall trend is still bullish.
💡 My reading of the scene:
What’s happening now is structural consolidation to test the patience of retail traders. The price is holding higher lows, and the current demand zones are "position-building" areas for those who know how to snipe before the next strong move.
Summary:
The market often kicks out the "nervous ones" before the real breakout. Breaking the $2,500 barrier could be closer than many think.
Are you one of those who sell with the "red" or one who accumulates in silence? 👇 Waiting for your reads.

#Ethereum #ETH #BinanceSquare #TechnicalAnalysis #MarketSentiment