
1. Market Overview: The Potential Crisis Behind the US Stock Surge
Current time is May 14th, morning in UTC+8. Recently, US stocks have been performing exceptionally well, showing a continuous rally. Such movements are not uncommon in history but often carry risks. This current market reminds one of the internet bubble around 2000 — a phase that was wild, blind, and full of temptation.
Yesterday's surge in US stocks was anticipated.
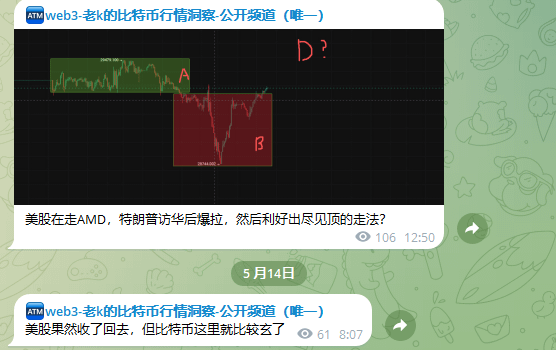 When the 'K小姐姐' types start to blindly chase the long positions, rational investors should stay alert. This 'shitcoinization' spike often signals that risk is just around the corner. Therefore, at these high levels, the risk-reward ratio for going long on US stocks is extremely low.
2. Bitcoin review: Liquidity trap after a false breakdown.
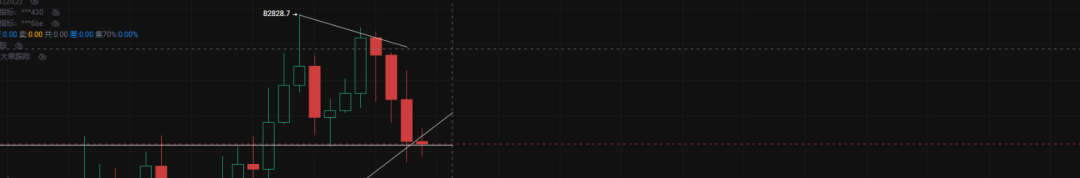
Looking back at yesterday's analysis on Bitcoin (BTC), the market presented a classic signal: the price briefly broke below a critical triangular convergence zone but quickly reclaimed it. This 'false breakdown' signal was previously warned about in the analysis.
Earlier, we focused on the critical level of $79,500 and pointed out that if it couldn't effectively break below, a 'scalping' short-term long trade could be attempted. Although the previous target was set at $83,000, based on the latest market data analysis, we found significant sell pressure in the range of $81,500 to $82,000. Indeed, Bitcoin faced resistance and pulled back around $81,200.
3. Technical pattern analysis: Daily chart shows a 'Evening Star'.
From the daily chart, Bitcoin's movement is becoming extremely subtle. Currently, the candlestick pattern resembles a bearish 'Evening Star' or 'Three Black Crows', which is a classic top reversal signal in textbooks.
The current closing price remains around $89,000. Although this level aligns with the left-side low pivot, it hasn't managed to firmly hold above it nor completely break below. This 'subtle alignment' often precedes a storm. On the hourly chart, after clearing liquidity at $81,200 from the left-side high, the price swiftly plummeted and is currently at a support level where the rising trend line meets the previous pivot. While support appears to exist, the risk of continuous decline will not be alleviated if a volume-driven hourly Market Structure Shift isn't achieved.
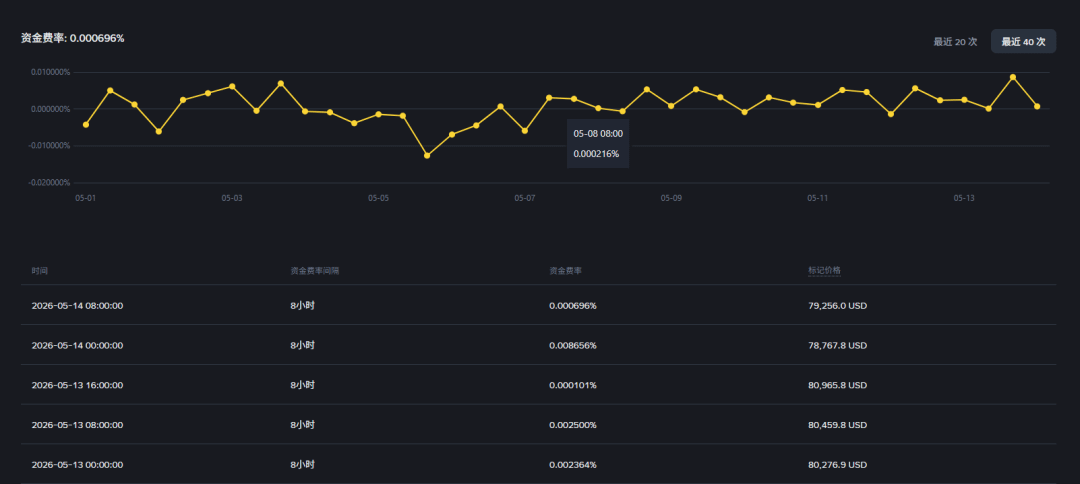
4. Market data insight: Funding rates and liquidation risks.
Using market tools (CVD and funding rate), we can more clearly capture the psychological game between whales and retail traders:
·Funding rate turns positive: Unlike the prolonged negative funding rates from earlier, both Binance's coin-margined and USDT-margined rates have now turned positive. This means that even during the price drop, many retail traders are still trying to buy the dip.
·
·CVD and long/short ratio: The contract CVD remains level, showing that bulls are trying to hold at low levels, but the long/short ratio indicates retail sentiment has shifted from earlier 'bearish' to 'neutral-bullish'.
·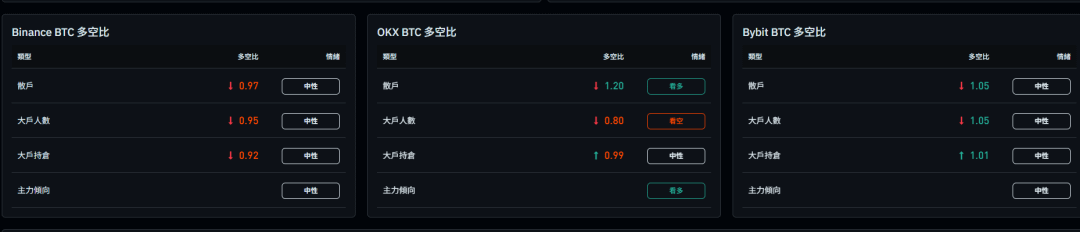
·Chain liquidation risk: A large number of long stop-loss orders are concentrated around $78,000. Once the price effectively breaks below this critical level, a chain liquidation could easily trigger, causing a rapid price collapse.
·ETF divergence signal: It's worth noting that despite a surge in US stocks yesterday, Bitcoin ETFs experienced a net outflow. This divergence signal further confirms that the market may have reached a short-term top.
5. Investment strategy recommendation: Focus on defense and wait for structural opportunities.
Based on the above analysis, Old K presents the following core trading viewpoints:
1. Bullish strategy (short-term): Limited to ultra-short 'scalping' trades, using the current support level's brief rebound to capture liquidity space above, but strict stop-loss must be in place.
2. Bearish strategy (core): The overall trend currently leans towards bearish. It is advisable to monitor the liquidity situation above $81,200 to $81,400. If the price rises again and fails to hold, it will present a good opportunity to enter short on the left side. Stop-loss can be set above $81,412.
3. Medium to long-term layout: This is not an ideal entry point for medium to long-term positions. It is advisable to patiently wait for the arrival of key support zones below:
oFVG gap fill zone: Watch the price's rebound strength at the gap.
o Weekly level support: Focus on the swap position below $75,000.
4. Altcoin risk alert: If Bitcoin's daily closing price falls below $79,000, the altcoin market will face a systemic risk of 'collapse', and investors are advised to remain extremely cautious before that.
Summary: There's nothing new under the sun; investment should respect historical experiences and market logic. In light of the whales completing their chip distribution and retail sentiment being overheated, protecting profits is more crucial than blindly entering the market.
❀❀END❀❀