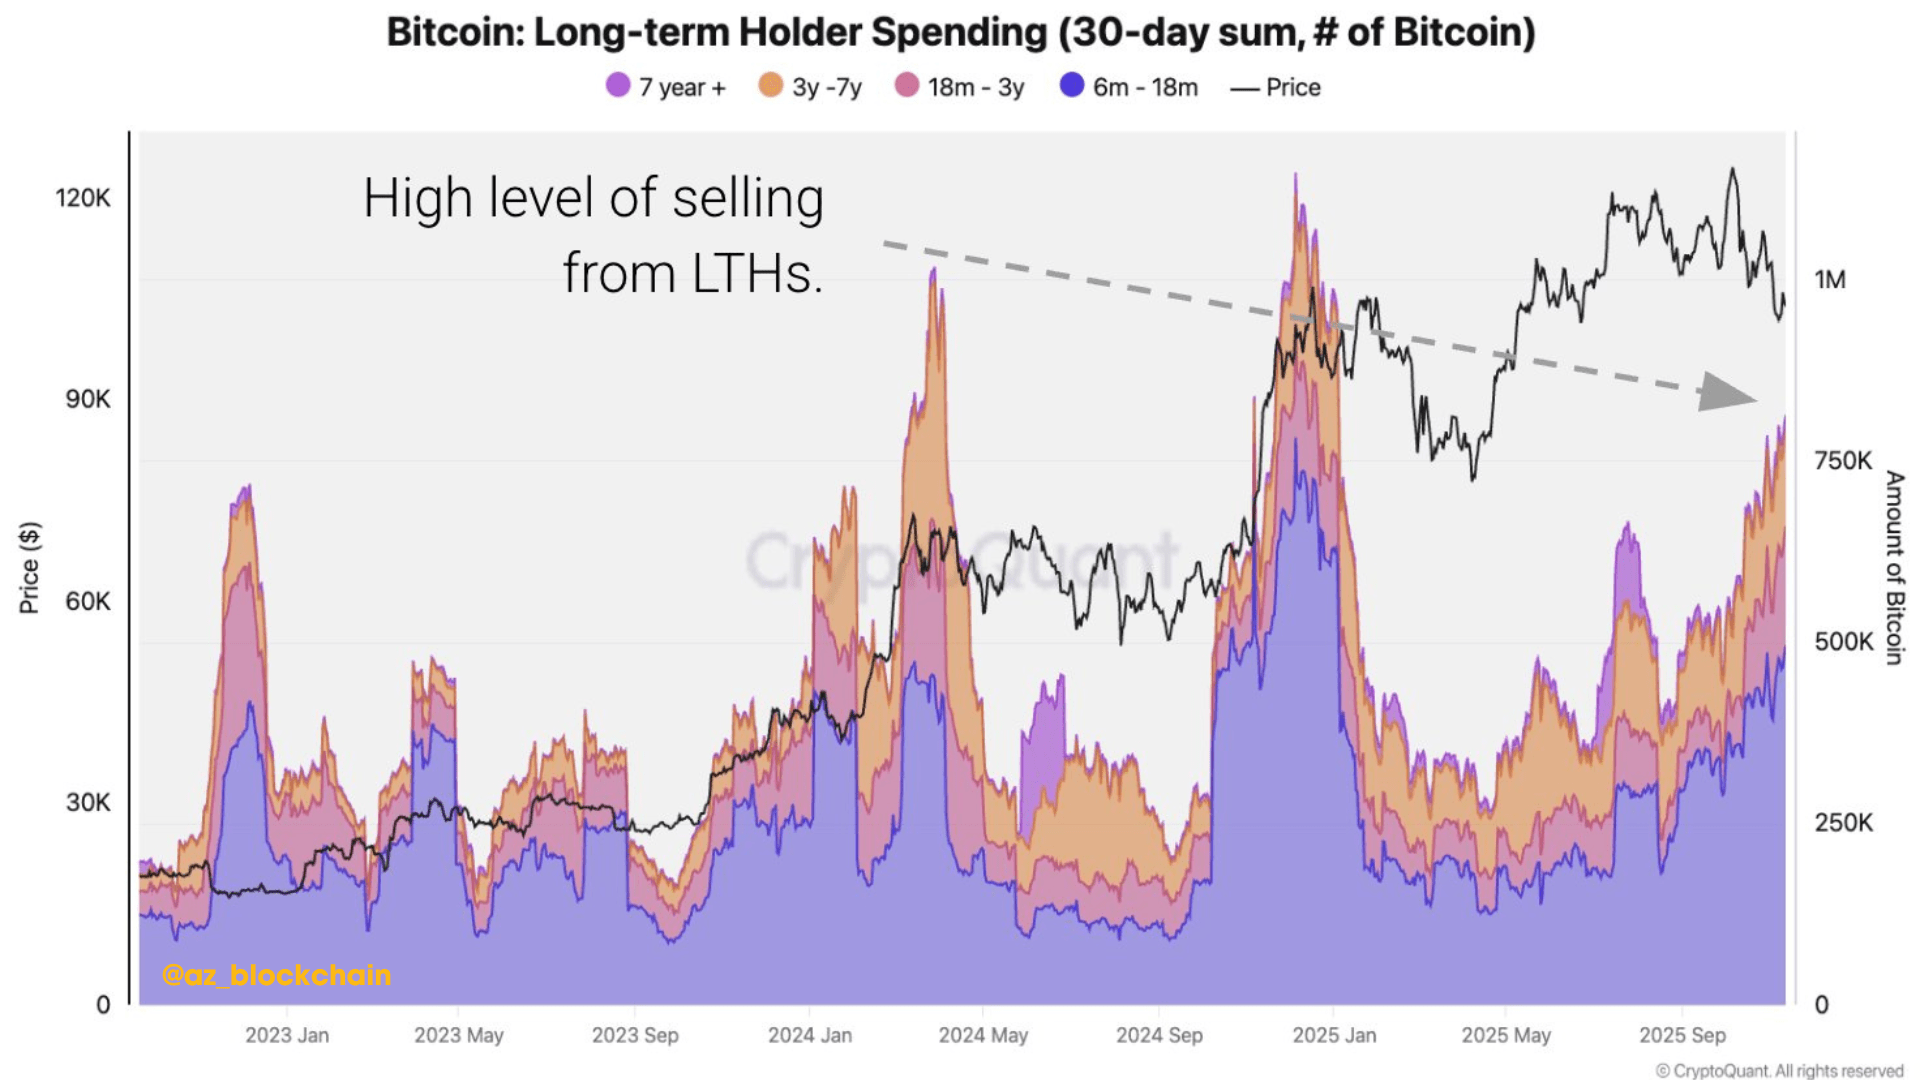
The chart shows that the spending level of Long-Term Holders (LTHs) is rising again over the last 30 days. This group holds $BTC from 6 months to over 7 years, and their behavior always has a strong influence on the market cycle.
🔥 Notable point in the chart:
The volume $BTC sold by LTHs is rising again to high levels, equivalent to previous cycle peak phases.
The selling trend is consistent across all time frames (6m–18m, 18m–3y, 3y–7y, 7y+).
Price $BTC (black line) remains high, but the spending level of LTHs creates short-term supply pressure.
💬 What does this mean?
1️⃣ Long-term holders (LTHs) are taking profits after a strong upward cycle – a normal occurrence in every bull market.
2️⃣ When LTHs sell a lot, the market often enters a redistribution phase, where the supply shifts from long-term holders to new buyers.
3️⃣ Past peak selling phases of LTHs often mark market transitions, not the end of a cycle, but a slowdown before creating a new peak.
⚡ Important:
Even though LTHs are selling heavily, this supply is still being absorbed well by the market — because the price of BTC has not shown any significant breakdown signs. This indicates that demand remains strong, especially from institutions and ETFs.
😎 In summary:
LTHs sell a lot → not a bad signal, but a natural redistribution rule.
As long as the price of BTC maintains a higher upward trend than the previous low, the market is still in the safe zone of a bull market.
Short-term traders should pay attention → this phase is prone to strong fluctuations, but the opportunities are even greater.
#BTC #OnchainData #MarketAnalysis #CryptoNews #az_blockchain


