
The Bitcoin market is in one of the most decisive moments of the bull cycle. The structure that has taken shape over the last few months points to a possible ending diagonal in the midst of macro wave 5, a pattern that historically marks the last major impulse before a deep correction.
Next, we present a clear and direct analysis of the validity of the count, the recent false breakout, and the scenarios that could confirm or invalidate this structure. $BTC

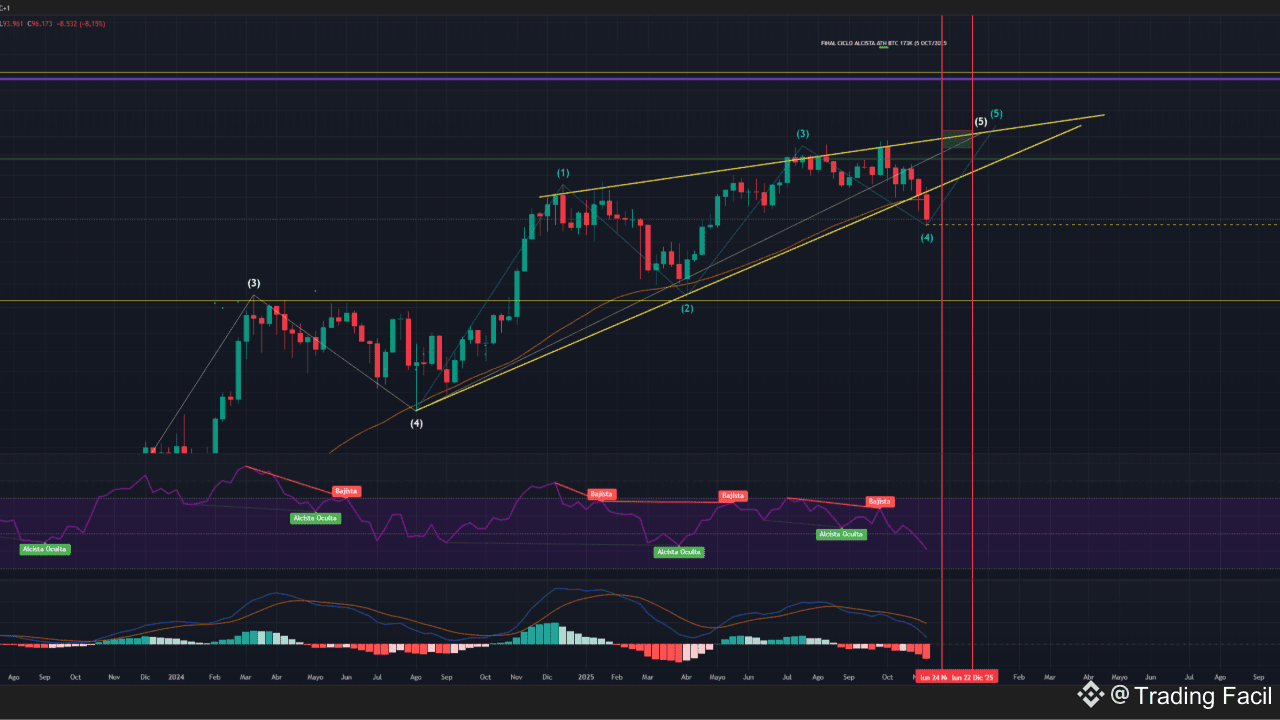
The final diagonal: the pattern that defines the end of the cycle
A final diagonal is a typical exhaustion figure of wave 5. It is characterized by movement within a converging channel, five internal corrective waves (3-3-3-3-3), overlaps allowed, and a final rally that is normally explosive.
Bitcoin meets all technical criteria: the channel holds, corrective waves are present, and price contraction is evident.
The false breakout: why it does not invalidate the structure
Recently, the price momentarily broke through the lower line of the channel. This movement generated concern, but technically does not invalidate the pattern for several reasons:
The breakout was only a wick, not a solid close.
In final diagonals, false breakouts are common due to market volatility in exhaustion zones.
Wave (4) did not strongly penetrate the structural territory of wave (2).
The price quickly returned to within the structure.
Therefore, the final diagonal remains in effect.
Invalidation levels: where the count is nullified
Although the structure continues to be respected, there are very clear levels that would mark the end of the count:
A real invalidation occurs only if Bitcoin closes below the macro base of the channel, either weekly with strength, or monthly with a defined candle body.
The critical zone is located below 92,000 USD.
Losing this level with a strong close would mean that wave (4) broke the structure and the count must be rethought.
In such a scenario, the market would enter a macro corrective phase, probably towards much lower levels.
Bearish scenario if the structure breaks
If the final diagonal is invalidated, the following zones would act as natural targets:
72,700 USD, previous cycle's old high.
55,000 – 61,000 USD, liquidity region of the 2024 cycle.
48,000 USD, a historic level of macro average.
This scenario would represent a complete change in the technical and psychological structure of the market.
Bullish scenario: signals that would confirm wave 5
If the price maintains support and starts to recover key levels, the necessary signals would emerge to confirm the final wave 5 of the cycle.
A close above 104,500 USD would be the first solid signal of recovery.
Subsequently, breaking the zone 114,000 – 118,000 USD would clear the way to the top of the channel.
The natural targets of the diagonal are located at:
126,000 – 138,000 USD (Fibonacci extension).
150,000 – 159,000 USD (top of the converging channel).
Upon reaching those levels, wave 5 would be confirmed as the final movement of the current cycle.
Conclusion: a decisive point for Bitcoin
Despite the false breakout, the final diagonal structure remains the dominant count. The price remains within the channel and wave (4) continues to respect the technical criteria.
Bitcoin is now in the most critical area of the cycle:
If it respects support and breaks resistances, wave 5 could take it to 126k–150k.
If it loses the structure with a monthly close, the count becomes invalidated and the drop could deepen towards 72k or even 55k.
Easy Trading will continue monitoring this count, the most important of the cycle, to keep the community informed with clear and timely analysis.