For everyone who wanted to analyze and read the candles and indicators...
Now, after reading this article, you will, God willing, transform from a beginner to a real trader 💪💯
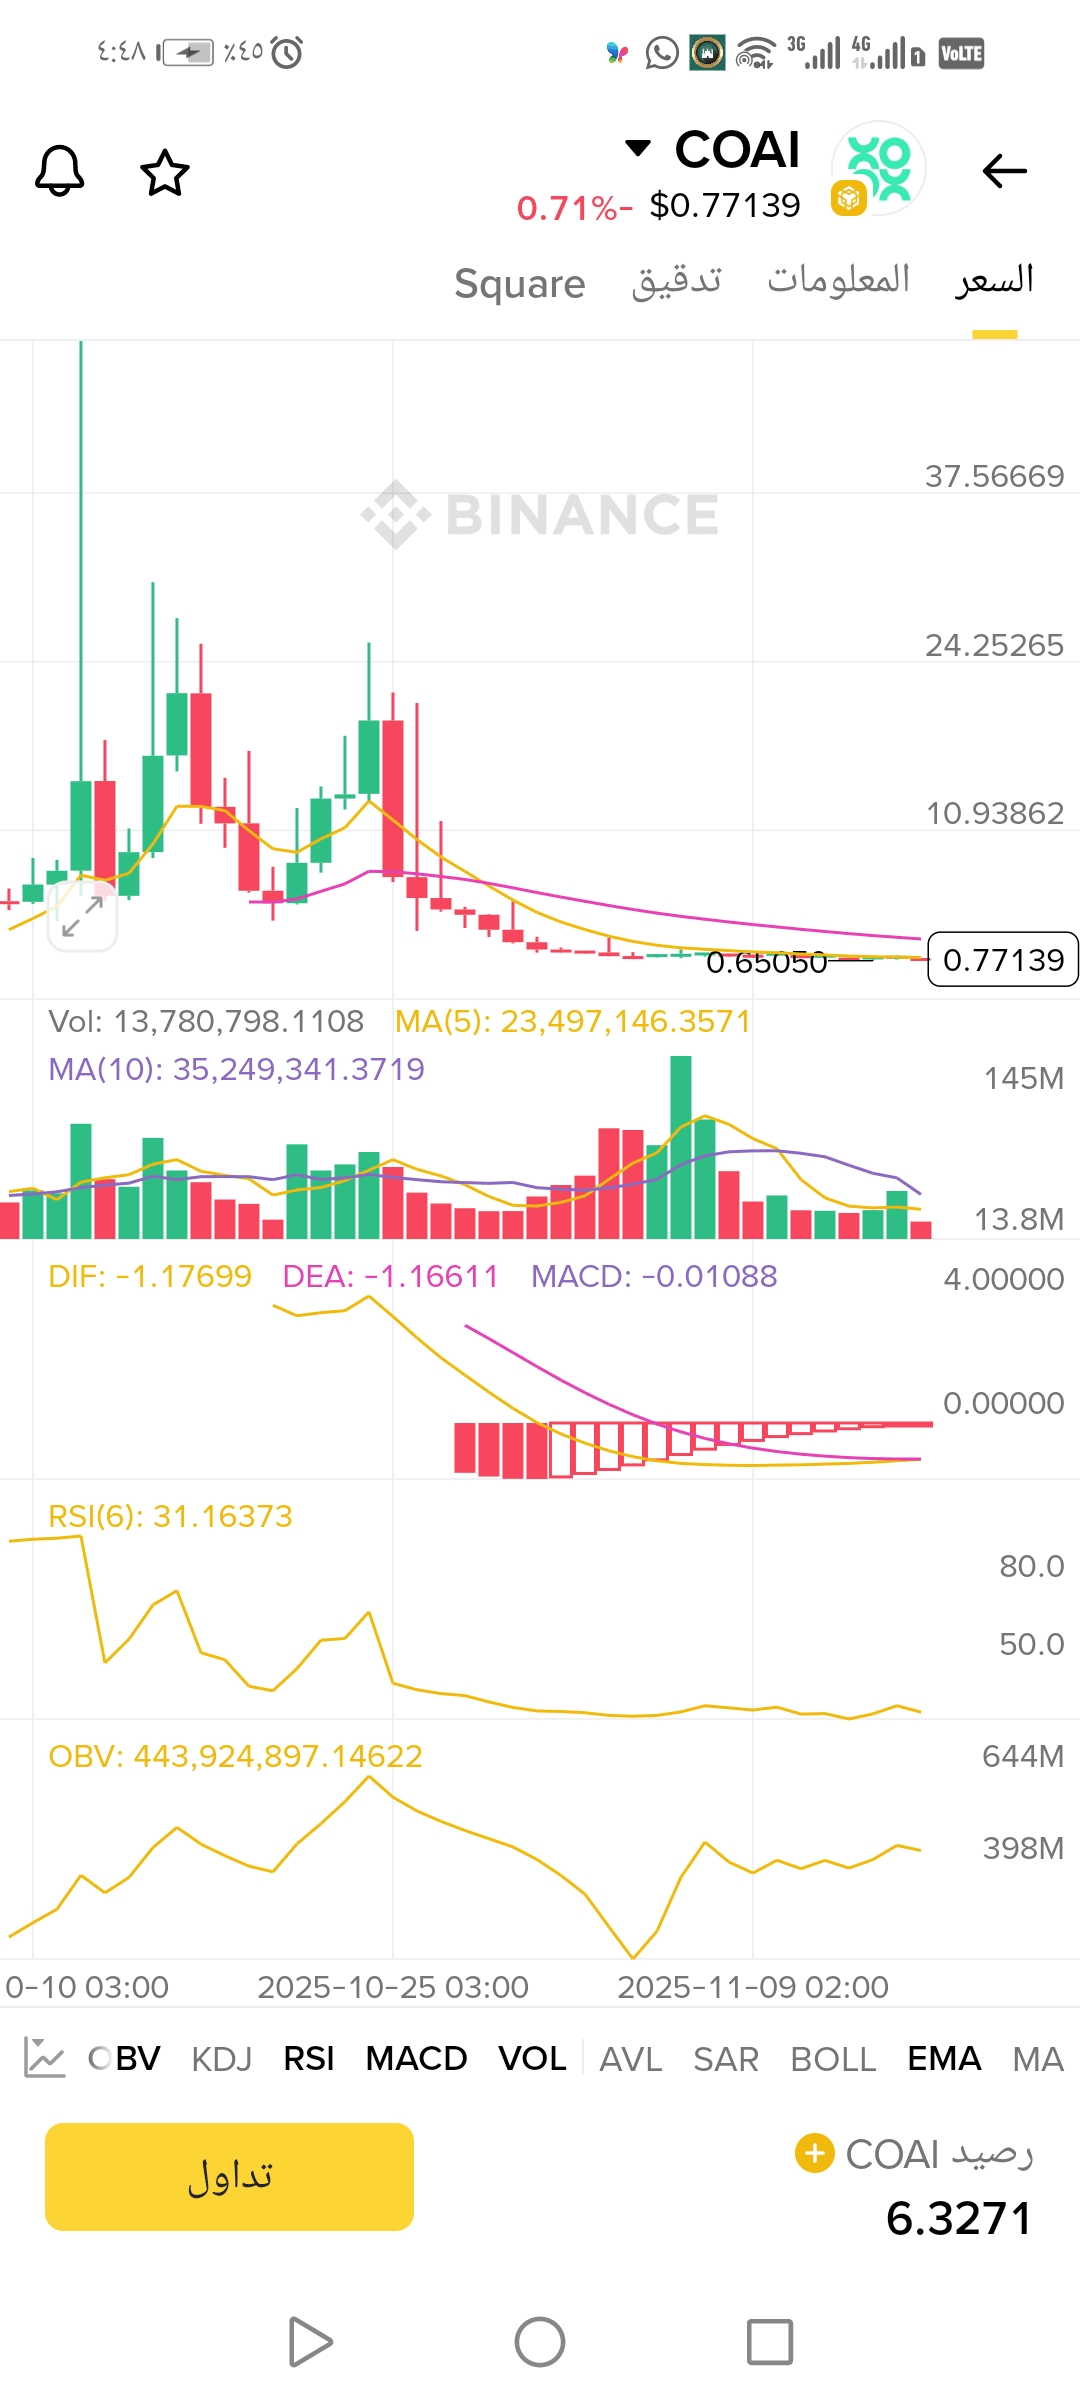
🔶 📌 Comprehensive analysis of the chart and indicators for COAI — Accurate professional reading
ـــــــــــــــــــــــــــــــــــــــــــــــــــــــــــــــــــــــــــــــ
🔵 First: Reading Japanese Candlesticks (Candlesticks)
✔ The Japanese candles in the picture clearly show that the currency experienced a strong upward wave followed by a long downward phase.
🟢 Green candles = Buying pressure, closing higher than the opening.
🔴 Red candles = Selling pressure, closing lower than the opening.
🟡 Upper and lower shadows = Strength of rejection from buyers or sellers.
✨ Important note: The presence of small candles at the end indicates weakness among sellers and the possibility of forming a consolidation bottom.
ـــــــــــــــــــــــــــــــــــــــــــــــــــــــــــــــــــــــــــــــ
🟣 Second: Moving Averages MA5 — MA10
🔶 MA5 (Yellow)
🔷 MA10 (Purple)
Technical analysis shows:
🔻 MA5 below MA10 = The trend is still bearish.
🔻 Both are sloping downwards = Continued selling pressure.
🔺 Their proximity to each other gives an early signal of a potential upcoming reversal.
✨ Note: Any breakout of the currency price above MA10 with increased trading volume = Strong buy signal.
ـــــــــــــــــــــــــــــــــــــــــــــــــــــــــــــــــــــــــــــــ
🟢 Third: Trading Volume (Volume)
The red and green bars below the chart illustrate the strength of participation.
🔺 Large volume during a decline = Strong selling.
🔻 Gradual decrease in volume during the decline = Possibility of the selling wave ending and forming a bottom.
✨ Note:
When you see a large green candle + high volume after a period of decline = Often the beginning of a reversal.
ـــــــــــــــــــــــــــــــــــــــــــــــــــــــــــــــــــــــــــــــ
🟡 Fourth: MACD Indicator — Momentum Strength
Values:
DIF = -1.176
DEA = -1.166
MACD = -0.010
🟣 MACD Analysis:
✔ The red bars are shrinking (Histogram) = Diminishing bearish momentum.
✔ The proximity of the DIF and DEA lines = Approaching a positive crossover (Bullish Cross).
✨ Note:
The positive crossover is stronger if it occurs above the zero line, but it is still useful even if it is below as it indicates weakness among sellers.
ـــــــــــــــــــــــــــــــــــــــــــــــــــــــــــــــــــــــــــــــ
🔴 Fifth: RSI Indicator (6) — Rapid Overbought/Sold
RSI Value = 31
✔ Below 30 = Oversold area.
✔ 31 is very close to overbought, indicating that the price is exhausted in the downward movement and may be preparing for a rebound.
✨ Strong note:
RSI for a short period (6) is very sensitive — it gives quick signals but can be false, so do not rely on it alone.
ـــــــــــــــــــــــــــــــــــــــــــــــــــــــــــــــــــــــــــــــ
🟠 Sixth: OBV Indicator — Volume of Smart Money Flows
OBV Value: 443,924,897
🔹 If OBV rises with the price = Smart money entering.
🔹 If OBV falls with the price = Liquidity exiting.
Current situation:
✔ OBV has started to slightly curve upwards → Light signal for a potential accumulation.
✨ Note:
Any sudden spike in OBV usually precedes a strong price movement.
ـــــــــــــــــــــــــــــــــــــــــــــــــــــــــــــــــــــــــــــــ
🔵 Seventh: General Trend of the Currency NOW
Based on all indicators:
🟥 The general trend is downward
🟧 The bearish momentum is weakening
🟨 Possibility of forming a sideways bottom
🟩 Short-term rebound chance if a green candle + strong volume appears
ـــــــــــــــــــــــــــــــــــــــــــــــــــــــــــــــــــــــــــــــ
🟣 Eighth: Important Price Levels on the Chart
🔻 Strongest support: 0.65
⬅ Any break of this level = New decline
🔺 First resistance: 0.77
⬅ Breaking it + Trading volume = Beginning of a short upward wave
✨ Very important note:
The price between support and resistance indicates a consolidation/waiting state.
ـــــــــــــــــــــــــــــــــــــــــــــــــــــــــــــــــــــــــــــــ
🔶 Ninth: Professional Summary and Potential Scenarios
📌 Potential bullish scenario:
🟢 Rebound from 0.65
🟢 Increase in buying volume
🟢 Positive MACD crossover
🟢 RSI above 40
→ First target 0.77
📌 Bearish scenario:
🔴 Break 0.65 + large volume
→ Opens the way for a new decline
📌 Sideways scenario:
🟡 If the price stays between 0.65 – 0.77
→ Accumulation before a strong upcoming movement
ـــــــــــــــــــــــــــــــــــــــــــــــــــــــــــــــــــــــــــــــ
📝 Important concluding notes for traders
⚠ Do not rely on one indicator
⚠ Always use stop loss
⚠ Monitor the volume as it is the most important thing during reversal moments
⚠ The currency trend is still bearish but weakness is clear in selling strength
⚠ The beginning of any upward wave will appear early in MACD + OBV
ـــــــــــــــــــــــــــــــــــــــــــــــــــــــــــــــــــــــــــــــ
✍ Hamdy Elbealy 1
