
🚨 MARKET UPDATE: BTC, ETH, & BNB at a Crucial Crossroads! False Breakdown or Further Dive? 📉 OPEN LIQUIDITY OBLIGATION!
The crypto market is undergoing a pretty intense mid-May correction. Let's dissect the movements of BTC, ETH, and BNB using real-time market structure mapping and liquidity today (May 19, 2026).
Don't just jump in before checking this liquidity map! 👇
🟠 BITCOIN ( $BTC ) – Critical Level at $78,500
Bitcoin is currently in a very critical confluence area after experiencing a sharp sell-off over the weekend.
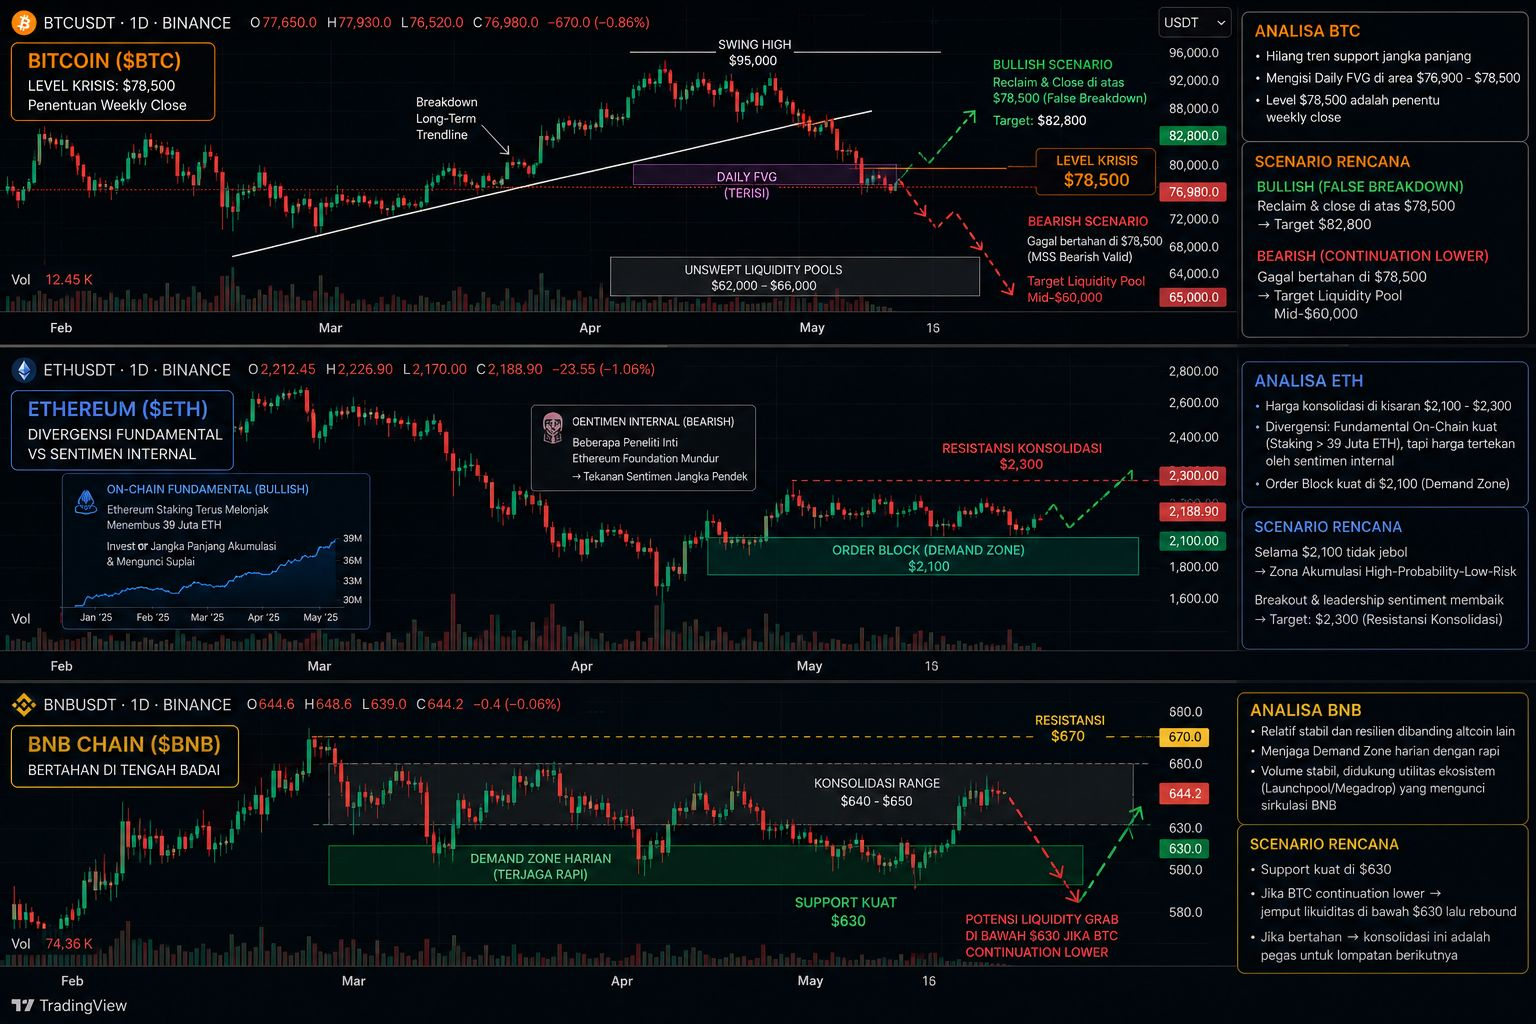
Market Condition: BTC has lost its long-term support trend. Currently, the price is stuck around $76,900 - $78,500.
Structure & Liquidity Analysis (SMC): The $78,500 level is our weekly close determinant. We just filled the Daily Fair Value Gap (FVG) in this area.
Scenario Plan:
Bullish (False Breakdown): If BTC can reclaim and close above $78,500, then yesterday's drop was merely a liquidity sweep (stop-loss hunting). The next target goes straight to $82,800.
Bearish (Continuation Lower): Failing to hold at $78,500 means a valid Bearish Market Structure Shift (MSS). Prepare nets in the mid-$60,000 area as there are unswept liquidity pools below.
 BTC64,294.4+1.13%
🔵 ETHEREUM ( $ETH ) – Fundamental Divergence vs Internal Sentiment
ETH is showing interesting price action: On-Chain fundamentals are strengthening, but the price is still pressured in a consolidation phase.
Market Condition: ETH is trading in the $2,100 - $2,300 range.
Structure & Liquidity Analysis (SMC): There is a significant divergence! Data shows Ethereum Staking continues to surge past 39 million ETH (meaning long-term investors are doing massive accumulation and locking supply). However, technically, the price is held back due to internal issues with some core researchers of the Ethereum Foundation stepping back.
Scenario Plan:
Technically, ETH is forming a strong Order Block in the $2,100 area. As long as this area does not break, it is a High-Probability-Low-Risk accumulation zone. If leadership sentiment improves, the nearest breakout target is at the upper consolidation resistance.
 ETH1,674.85+0.61%
🟡 BNB CHAIN ( $BNB ) – Holding Steady Amidst the Storm
BNB is relatively stable and showing decent resilience compared to some other major altcoins during this mid-May correction.
Market Condition: BNB is currently trading in the $640 - $650 range (or around Rp 11,300,000).
Structure & Liquidity Analysis (SMC): BNB is still maintaining its daily Demand Zone quite neatly. Trading volume is relatively stable, supported by ecosystem utility (Launchpool/Megadrop) that continues to lock in BNB circulation in the market.
Scenario Plan:
Watch the strong Support level at $630. If BTC experiences a continuation lower, BNB is likely to scoop liquidity below that level before rebounding. If it holds, this consolidation area is a springboard for the next jump.
 BNB608.81+1.42%
🛡️ Key Risk Management Today (What to Watch)
Keep a close eye on USDT Dominance (USDT.D). If USDT.D continues to rise and breaks resistance, it means traders are fleeing to stablecoins, and the market could potentially dump deeper. Manage your risk, use a Stop Loss below daily structure invalidation.
What do you all think? Is it time to scoop up at the FVG discount, or are you choosing to wait in the mid-$60k? Drop your predictions in the comments! 👇
⚠️ Disclaimer: Not financial advice (DYOR). This analysis is created for educational purposes in mapping market structure.
#BTC走势分析 #Ethereum #BNB_Market_Update #TechnicalAnalysis #SmartMoneyConcepts #Crypto2026 #Binance #Write2Earn #BinanceSquare #BinanceSquareFamily