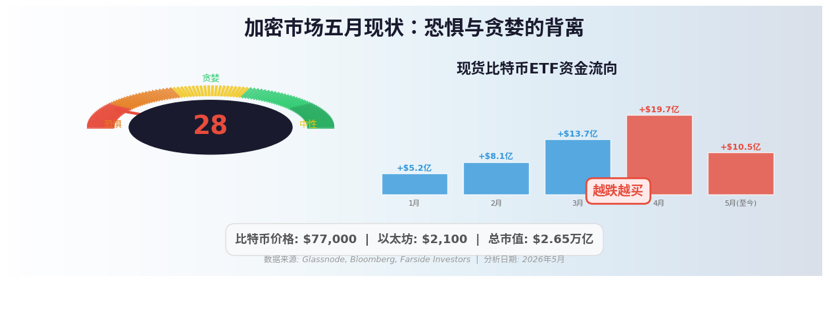
In May 2026, the crypto market is at a pivotal structural turning point. Bitcoin is battling around the psychological barrier of $80,000, with the Fear and Greed Index dipping to 28, indicating extreme fear. However, at the same time, the spot Bitcoin ETF recorded a record net inflow of $1.97 billion in April, as institutional funds keep buying the dip with a "buy the dip" strategy. Ethereum has lost the $2,100 mark, and altcoins are generally under pressure, with the total market cap hovering around $2.65 trillion. This article will analyze the current market landscape from three dimensions: macro liquidity, institutional fund flows, and technical structure, while proposing an asset allocation strategy based on risk layering and a price path outlook for the second half of the year.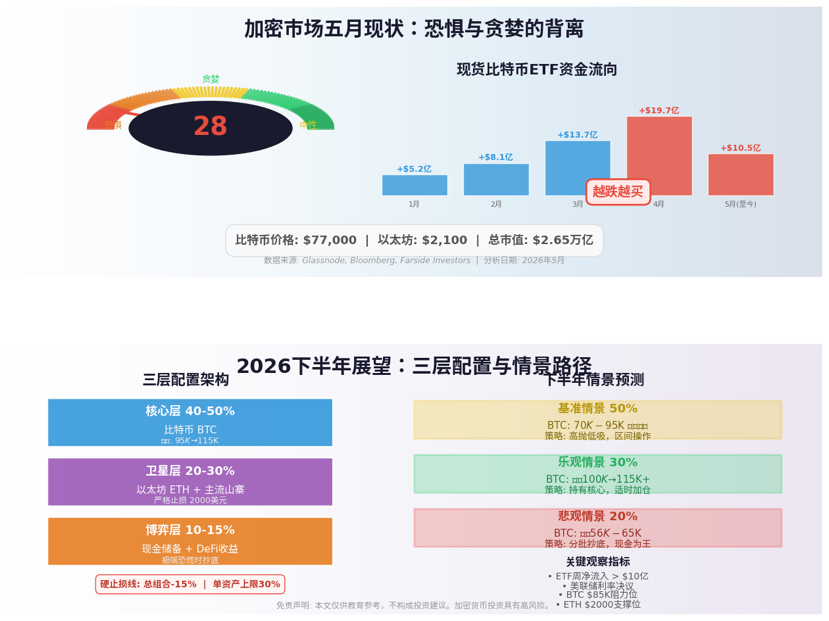
1. Market Status: Fear Index 28 and Institutional Bottom Fishing Divergence
As of mid-May, the crypto market's Fear and Greed Index stood at 28, in the 'extreme fear' range. Bitcoin price fluctuated around $77,000, retreating about 30% from its early-year high; Ethereum fell to around $2,100, with a 24-hour drop exceeding 3% at one point. On the surface, this appears to be typical bear market sentiment, but on-chain data and ETF fund flows reveal a completely different story.
The spot Bitcoin ETF recorded a net inflow of $1.97 billion in April, marking the strongest single-month performance since 2026, far exceeding March's $1.37 billion. On May 7 alone, the ETF's net inflow reached $1.05 billion, the highest in 111 days. BlackRock's IBIT attracted about $2 billion in April, closely followed by Fidelity's FBTC. This 'price drop, fund inflow' divergence model is completely different from the retail FOMO (Fear of Missing Out) seen during the early days of ETF listings in 2024—it reflects systematic allocation behavior by institutional investors rather than speculative trading.
What is more noteworthy is the strong 'stickiness' of ETF funds. Even in mid-May, when Bitcoin fell below $80,000 and market panic intensified, institutional funds continued to flow in. Bloomberg ETF analyst Eric Balchunas pointed out that by 2026, cumulative net inflows into Bitcoin ETFs had surpassed $1 billion, with total historical net inflows nearing $58 billion, just about $5 billion away from the historical high. This 'buy the dip' behavior pattern indicates that institutions view the current price level as a long-term strategic allocation range rather than a short-term trading opportunity.
2. Macro Environment: Federal Reserve Policy and Liquidity Game
The core contradiction in the current crypto market lies in the tug-of-war between the extreme abundance of institutional funds and the uncertainty of macro liquidity.
The Federal Reserve ended quantitative tightening (QT) in December 2025, but the benchmark interest rate remains high at 3.00%-3.25%. This interest rate level creates a 3% 'risk-free return' threshold for all risk assets, meaning DeFi protocols and crypto assets must provide real returns exceeding 3% to attract funds. This is a stark contrast to the 'liquidity flood' during the zero interest rate era of 2020-2021, as the market undergoes a structural transformation from 'speculation-driven' to 'value-driven.'
The unexpected surge in the U.S. Producer Price Index (PPI) in mid-May reignited market concerns about inflation stickiness, delaying expectations for Fed rate cuts. This directly led to Bitcoin breaking the psychological barrier of $80,000. However, the U.S. Treasury injected $35 billion in liquidity into the financial markets in early May to ease tensions in the short-term financing market. This 'fiscal easing, monetary tightening' complex environment creates a unique liquidity window for the crypto market.
From a longer-term perspective, the Fed in December 2025 removed the daily $500 billion limit on standing repurchase agreements (SRP), allowing banks to borrow from the Fed using treasuries as collateral without restriction. This policy significantly increased market liquidity and planted the seeds for a rebound in the crypto market. Historical experience shows that when real interest rates start to decline and dollar liquidity expands, Bitcoin often exhibits the strongest resilience.
3. Technical Structure: Key Support and Resistance Levels Battle
From a technical analysis perspective, Bitcoin is currently in a complex consolidation range. $80,000 has shifted from a previous psychological support to short-term resistance, while the $75,000-$76,000 range has formed an important structural support. Glassnode data shows that the Active Realized Price is around $85,200, which constitutes significant resistance, described as the 'ceiling' Bitcoin needs to break through.
CryptoQuant's analysis indicates that the key downward support level in the next 3-6 months is around $70,000, with a more pessimistic bearish scenario potentially testing $56,000. However, the 50-week exponential moving average has converged near $80,000, forming a historic support convergence point. In previous bull market cycles, this technical indicator has repeatedly marked significant turning points.
The technical outlook for Ethereum is more fragile. $2,100 is not only a key psychological level but also a support area tested multiple times since August 2024. If breached, it could open up a space down to $1,800 or even lower. However, it is worth noting that Ethereum ETFs recorded a net inflow of $356 million in April, indicating a resurgence of institutional interest in ETH.
From a cyclical theory perspective, there are two diametrically opposed viewpoints in the market. Fidelity's Jurrien Timmer believes that the four-year halving cycle's bull market phase ended in October 2025 (with a peak around $126,000), and we are currently in a 'winter' consolidation phase, expecting the next major support to test the $65,000-$75,000 range. Conversely, Fundstrat's Tom Lee believes that persistent ETF demand and regulatory support could drive Bitcoin towards a long-term bull market target of $250,000.
The options market pricing reflects this extreme uncertainty: the probability of Bitcoin dropping to $50,000 or skyrocketing to $250,000 by the end of the year is almost equal. This 'bimodal distribution' suggests that the market is at a significant directional choice node.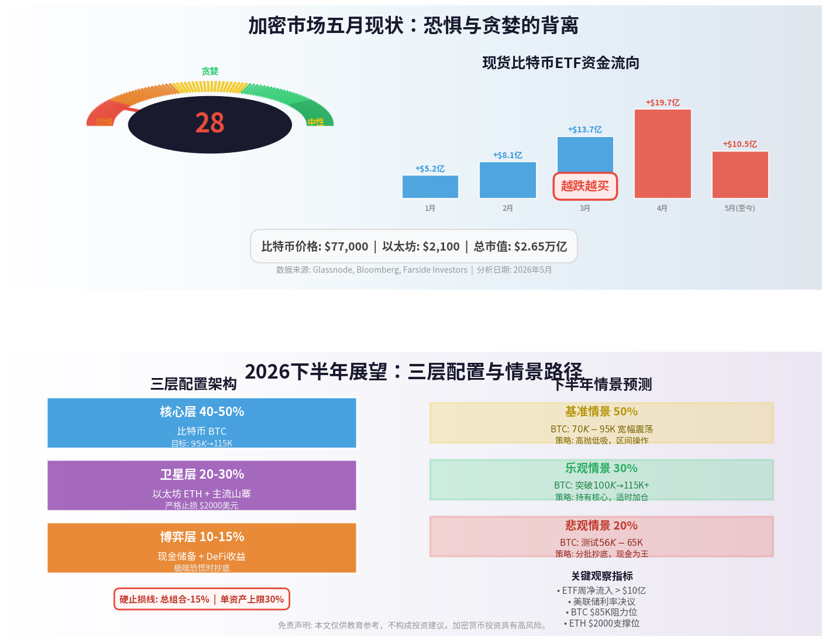
4. Operational Strategy: Three-Layer Risk Architecture Allocation
Based on the current market environment, we recommend adopting a 'core-satellite-speculative' three-layer allocation architecture:
First Layer: Core Position (40%-50%) — Bitcoin
Bitcoin remains the ballast of the entire allocation system. The current range of $75,000-$80,000 offers a favorable risk-reward ratio. It is recommended to adopt a staggered entry strategy: establish the first position near $76,000, add more if it drops to $70,000, and in extreme cases, $56,000 as the final strategic buy point. The holding period is suggested to be more than 6 months, initially targeting $95,000 (upper edge of previous dense transaction area), and after breaking through, look towards $115,000.
Second Layer: Satellite Position (20%-30%) — Ethereum and Mainstream Altcoins
Ethereum enters the value range below $2,100, but be cautious of technical breakdown risks. It is recommended that positions do not exceed 20% of total assets, and strict stop-losses should be set (e.g., reduce by 50% if it drops below $2,000). For altcoins like Solana and XRP, which have already launched ETFs, small positions (within 5% each) can be taken, but recognize that these assets have far lower liquidity than Bitcoin and may face additional drawdowns of 30%-50% in extreme market conditions.
Third Layer: Speculative Position (10%-15%) — Cash and Opportunity Reserves
Maintain a 10%-15% cash or stablecoin position to seize bottom-fishing opportunities during sudden crashes. Historical experience shows that extreme panic moments when the Fear and Greed Index is below 20 often represent the best mid to long-term buying points. Additionally, this portion of funds can be used to participate in liquidity mining within DeFi protocols, earning 3%-5% annualized returns with stablecoin pairs like USDC and USDT, serving as a 'cash flow' supplement for the portfolio.
Risk Control Principles:
• Single asset positions should not exceed 30% of total assets
• Set a hard stop-loss line for the total portfolio at 15%
• Adjust positions dynamically each month based on the Fear and Greed Index: add positions when the index is below 20, reduce when above 75
• Avoid using leverage exceeding 2x
5. Outlook for the Second Half of the Year: Path from Consolidation to Breakthrough
For the second half of 2026, we provide three scenario analyses:
Baseline Scenario (50% Probability): Wide Range Consolidation
Bitcoin is oscillating between $70,000 and $95,000, while Ethereum is fluctuating between $1,800 and $2,500. ETF funds are continuously flowing in but are insufficient to push a breakout, with the market waiting for clear signals of interest rate cuts or favorable regulations from the Fed. In this scenario, the core strategy is 'buy high, sell low', adding positions at the lower end of the range and reducing at the upper end.
Optimistic Scenario (30% Probability): Q3 Breaks Previous Highs
If the Fed initiates a rate cut cycle in Q3 or the U.S. passes more favorable crypto regulatory legislation (such as the advancement of the GENIUS Act), Bitcoin is likely to break through $100,000, challenging the historical high zone of $115,000-$126,000. Ethereum may follow suit, rebounding above $3,000. In this scenario, maintain the core position and add to the satellite position as appropriate.
Pessimistic Scenario (20% Probability): Deep Correction Testing
If persistent high inflation leads the Fed to restart interest rate hikes or significant regulatory crackdowns occur (such as a stablecoin ban), Bitcoin may test the cyclical bottom at $56,000-$65,000. In this scenario, cash reserves will play a crucial role, allowing for gradual bottom-fishing during extreme panic.
Key Observational Indicators:
• Whether weekly ETF net inflows continue to exceed $1 billion
• Federal Reserve Interest Rate Decision and Dot Plot Changes
• Trends in U.S. CPI/PPI data
• Breakthrough of Bitcoin's $85,000 resistance level
• Gains and Losses of Ethereum's $2,000 Support Level
The crypto market in May 2026 is at a rare intersection of 'institutional greed' and 'retail fear'. The continuous inflow of ETF funds proves institutional recognition of the long-term value of crypto assets, while macroeconomic uncertainty creates a breeding ground for short-term volatility. For investors, this is not the time to chase short-term profits, but rather a window to establish long-term strategic positions. Remember, during a Fear and Greed Index of 28, history often favors the patient.
Disclaimer: This article is for educational and informational reference only and does not constitute investment advice. Cryptocurrency investments are highly risky; please make independent judgments based on your financial situation, investment goals, and risk tolerance.#美法院驳回Kalshi等暂停州诉讼 #加密总市值逼近2.6万亿 #Saylor称1亿人持BTC #Stripe推出稳定币区块链 #Warsh出任美联储主席 $BTC


