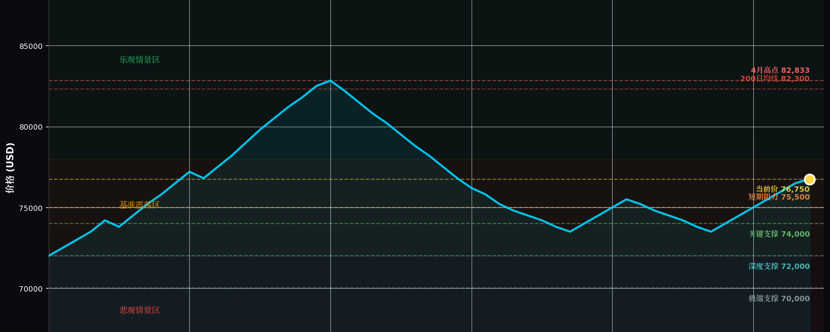
In late May 2026, the crypto market is undergoing a structural correction. Bitcoin hit a peak of around $82,833 at the start of the month but has been on a downward trend, trading around $76,750 as of May 24, with a seven-day drop of approximately 1.85%. The main driver of this correction isn't just one bearish event; rather, it's the systematic withdrawal of institutional funds through the spot ETF channel—over the past two weeks, U.S. Bitcoin ETFs have seen a cumulative net outflow of $1.42 billion, with a record single-day outflow of $648.6 million on May 18. Meanwhile, major altcoins like Ethereum are showing even weaker performance, with the total crypto market cap shrinking from $2.73 trillion to a range of about $2.5 trillion to $2.63 trillion. The Fear and Greed Index is hovering in the "fear" zone at 27-34. This report analyzes the current market structure from four dimensions: macro environment, capital flow, technical patterns, and on-chain data, and proposes an operation strategy categorized by risk levels.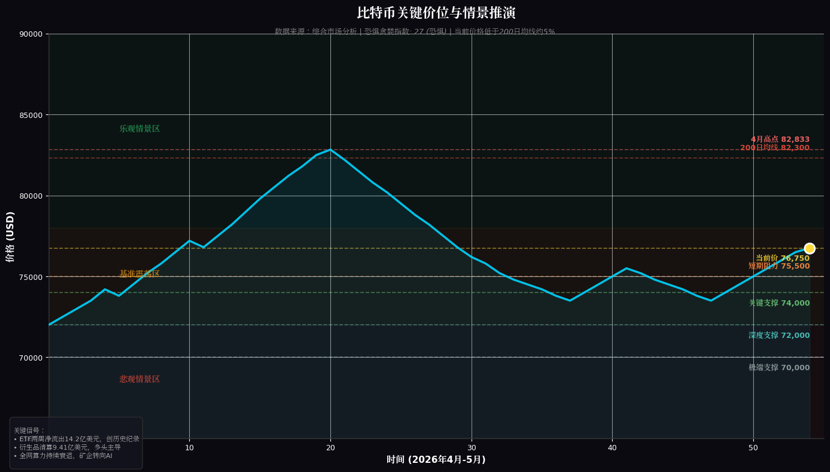
One, Market Environment and Core Contradictions
The current market presents three core contradictions, determining the complexity of short-term price trends.
The first set of contradictions: the divergence between institutional withdrawals and accumulation by long-term holders. The outflow of funds from the spot ETF channel is the most direct driver of this round of adjustments. BlackRock's IBIT and Fidelity's FBTC net flowed out $68.9 million and $10.12 million, respectively, on May 22, indicating that traditional financial institutions are reevaluating their crypto asset allocations. This withdrawal may be related to regulatory uncertainties—the SEC has delayed plans related to blockchain tokenization for stocks, and the disputes between the SEC and CFTC over market structure regulation continue to simmer. However, on-chain data shows that long-term holders are still quietly accumulating, and the low-price range under fear sentiment is attracting contrarian capital flows.
The second set of contradictions: the battle between technical support and trend pressure. Bitcoin has formed a key support zone around $74,000; if it breaks this level, it may test the $73,700 to $72,000 range. Resistance is focused at $75,500; only a stable hold at this position can improve the short-term technical structure. The more critical long-term technical level is the 200-day moving average at about $82,300, with the current price around 5% below this average, indicating that the market remains in a repair phase rather than confirming an upward trend.
The third set of contradictions: concerns over miner ecology and declining hash rate. VanEck's on-chain report indicates that although Bitcoin's spot price has rebounded by 11.8% month-on-month, the network's hash rate has shown a continuous decline, marking the longest hash rate retracement period on record. The structural reason behind this is that U.S.-listed mining companies are redirecting resources towards AI infrastructure, rather than pure Bitcoin mining. If the divergence between hash rate and price continues, it may exert pressure on the network security model in the medium term.
Two, Capital Flow and Sentiment Indicators
Derivatives market liquidation data reveals the fragility of the leverage structure. From May 22 to 23, Bitcoin's drop below $75,000 triggered approximately $941 million in derivatives liquidations, predominantly from long positions. This forced deleveraging often creates tactical rebound conditions, but whether the rebound can turn into a reversal depends on whether spot demand returns. Currently, the trend of ETF outflows has not reversed, indicating that spot buying pressure has not effectively absorbed the selling pressure.
From a market breadth perspective, Bitcoin dominance remains above 58%, indicating that capital is contracting from altcoins back to Bitcoin, which is a typical risk-off mode. Ethereum has dropped 3%-5% during the same period, with some small and mid-cap tokens experiencing weekly declines of over 14%. Predictive market data from Polymarket shows that traders expect Bitcoin's price in May to concentrate in the $80,000-$90,000 range, with very low odds for aggressive targets like $150,000, reflecting cautious market sentiment.
Three, Key Price Levels and Scenario Analysis
Based on the current technical structure and capital flow, the report presents three hypothetical scenarios:
Baseline scenario (highest probability): Bitcoin remains in a consolidation range of $72,000-$78,000. This scenario assumes a slowdown in ETF outflows and no deterioration in the macro environment (U.S. Treasury yields, inflation expectations). Within this range, $74,000 is a critical support level that the bulls must hold, while $75,500 is the first key resistance to turn bullish in the short term. The $78,000-$80,000 range constitutes a dense resistance zone.
Optimistic scenario: Institutional capital flows back, Bitcoin returns above the 200-day moving average ($82,300), and pushes toward the $85,000-$90,000 resistance zone. Trigger conditions for this scenario include: a return of net ETF inflows, a shift in the Federal Reserve's monetary policy expectations toward easing, or major favorable regulatory developments. Historical data shows that when the fear index is at extremely low levels, it often corresponds to mid-term bottoms, and the current reading of 27 is close to the historical rebound trigger zone.
Pessimistic scenario: $74,000 support fails, leading to a deep pullback towards $72,000-$70,000. If ETF outflows continue and macro liquidity tightens, the probability of this scenario will increase. Another key support level below is in the $65,000-$69,000 range, which has been validated multiple times as a strong demand zone since 2026.
Four, Operational Strategy Recommendations
Conservative investors
At this stage, remain cautious and avoid establishing new long positions until the trend of institutional capital outflows reverses. Consider allocating 30%-40% of crypto assets to stablecoins or short-term U.S. Treasury tokens to retain tactical buying capacity. If Bitcoin shows a significant volume and stabilizes above $75,500, consider small position testing; if it drops below $72,000 and ETF outflows narrow, enter the phased accumulation zone. Set stop-loss at below $70,000.
Moderate investors
Adopting a core-satellite strategy, with core positions (50%-60%) allocated to Bitcoin, leveraging its high liquidity to navigate volatility; satellite positions (20%-30%) in mainstream assets like Ethereum, awaiting ETH's stabilization relative to BTC. The operation involves dollar-cost averaging instead of a lump-sum entry, dividing capital into 4-6 parts, starting the first investment in the $74,000-$76,000 range, and adding a part for every 3%-5% decline. The core logic of this strategy is to accumulate chips during times of fear, while strictly avoiding going all in at the bottom.
Aggressive investors
In the current market structure, there are two types of tactical opportunities. The first is an oversold rebound: the derivatives market shows negative funding rates (e.g., BCH funding rate at -0.0325%) and a very high long liquidation ratio, creating conditions for a short squeeze, but strict stop-loss measures must be set, and this only applies to highly liquid assets. The second is cross-asset arbitrage: Bitcoin dominance is at historical highs; if the market stabilizes, capital may rotate towards lagging assets like Ethereum. Monitor the ETH/BTC exchange rate to establish relative value positions in the range of 0.028-0.030.
Five, Risk Warnings and Monitoring Points
Investors should closely monitor the following variables: first, the daily capital flow of the U.S. spot Bitcoin ETF, which is currently the most leading sentiment indicator; second, the Federal Reserve's interest rate expectations and the trends in the 10-year U.S. Treasury yields, as the crypto market remains highly correlated with macro liquidity; third, changes in hash rate trends; if it continues to decline, it may trigger a reevaluation of market security; fourth, regulatory dynamics, particularly the SEC's final stance on tokenized securities and market structure rules.
It is crucial to emphasize that the current market is in a "demand fracture" fragile stage—derivatives traders maintain a slight bullish stance, but spot institutions continue to withdraw. In this structure, any rebound may represent an opportunity for profit-taking rather than chasing the pump. A genuine trend reversal requires seeing a return of net ETF inflows, prices stabilizing above the 200-day moving average, and macro conditions providing triple confirmation. Before clear signals emerge, maintaining patience and discipline is more important than chasing short-term volatility.
Disclaimer: This report is for informational reference only and does not constitute investment advice. The cryptocurrency market is highly volatile; investors should make independent decisions based on their risk tolerance and consider consulting a licensed financial advisor.#比特币走势分析 #市场动态 #BTC走势分析 #Ethereum #行情推演 $BTC


