On June 1, 2026, Bitcoin started a subtle game around the $73,500 mark. The daily moving averages are in a bearish formation, while the four-hour chart shows a weak bounce, leading to a cycle mismatch. Institutional ETFs saw a record net outflow of $2.3 billion in May, diverging from the historical positive returns usually seen in June. This article analyzes the current weak oscillation pattern from three angles: multi-period technical structure, institutional capital flow, and key price thresholds, detailing how traders can seek high-risk-reward opportunities in the $73,200-$75,000 range, and revealing the core indicators that will determine the direction for June.
1. Six-Month Review: The Market Sentiment Temperature Difference Behind Sevenfold Returns
On Children's Day, there are no fairytales in the crypto world, only cold candlesticks and burning anxiety.
When the 'crypto circle scholar' showcases a sevenfold return for the first half of the year, more retail traders are falling into typical behavioral finance traps—fearing to buy high and fearing to catch falling knives. This dual fear is not without basis: in May 2026, Bitcoin's spot ETF saw the largest monthly net outflow of the year, amounting to $2.3 billion, nearly ten times the redemption scale in February, while Bitcoin was only down 3.69% at that time. The speed at which institutions are de-risking far exceeds the degree of price weakness, and this 'silent withdrawal' is more deceptive than a crash.
The market's sense of fragmentation lies in the fact that long-term holders are starting to distribute, and whale accounts are reducing their positions. However, historical data shows that Bitcoin's median return rate in June over the past twelve years is positive at 2.58%, with only five Junes closing in the red. When seasonal bullishness meets institutional capital outflow, the chart structure becomes the sole judge of the power dynamics between buyers and sellers.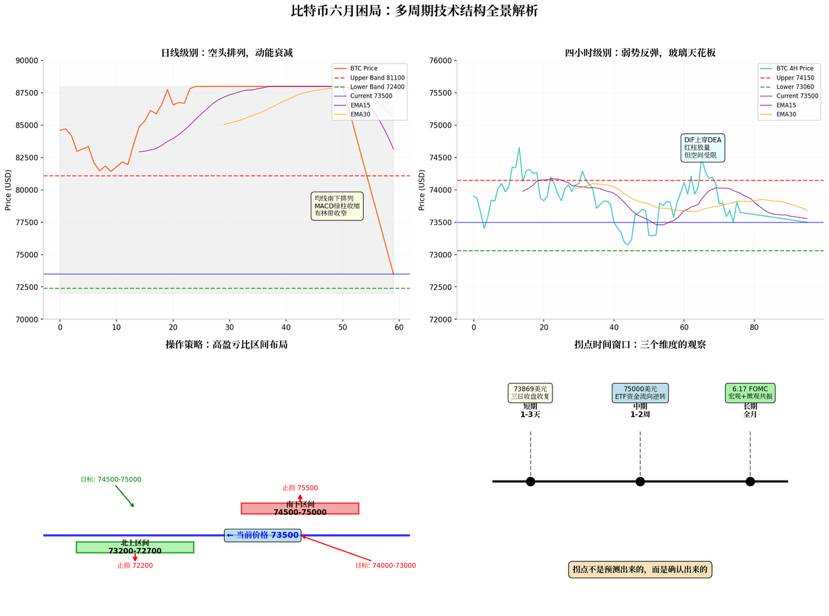
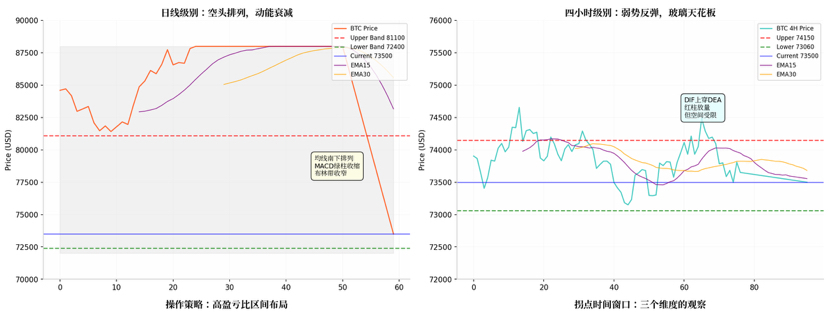
2. Daily pattern: Bearish arrangement with signs of diminishing momentum.
Opening the daily chart, Bitcoin at $73,500 is facing triple technical resistance.
The downward pattern of the moving average system is clear: the price is running below the EMA15 and EMA30, and the long-term moving averages are in a bearish arrangement, indicating that the trend selling pressure has not yet been lifted. It's worth noting that this arrangement has persisted for a while, meaning that the bearish energy is not sudden but has accumulated gradually.
The subtle changes in the MACD indicator are worth analyzing: the DIF line is still hovering below the DEA, and while the green bars have slightly contracted, a reduction in downward momentum does not equate to reversal. This is similar to a vehicle slowing down after releasing the accelerator while still moving in the same direction. Historical experience shows that such 'momentum decay' phases are often accompanied by volume contraction, and real directional choices require volume confirmation.
The Bollinger Bands are continuously narrowing, with prices running close to the lower band around $72,400, while the upper band pressure is far at $81,100. This 'constricted and sticking' state in technical analysis is known as 'low volatility buildup,' typically indicating an impending trend change, but the direction of the change requires external catalysts for confirmation. Currently, trading volume is moderate, and market sentiment is heavily cautious, with no clear bottom volume or top divergence signals, indicating that the short-term main tone remains slightly weak.
The core observation point at the daily level is whether Bitcoin can effectively stabilize above the EMA15. In a bearish arrangement, short-term moving averages often become dynamic resistance, and each touch may trigger new selling pressure. If the price continues to struggle to stay above this level, the downward pattern will persist; conversely, it would be the first step towards trend recovery.
3. Four-hour cycle: The 'glass ceiling' in the weak rebound.
In contrast to the pressure at the daily level, the four-hour chart presents a 'repairing' technical image, but this repair has obvious flaws.
The price enters a low-level consolidation phase, oscillating near the EMA15 and EMA30, with short-term moving averages flattening, indicating a temporary balance between bulls and bears. However, the long-term EMA120 forms dense resistance above, like a glass ceiling—visible but intangible. The MACD indicator shows the DIF crossing above the DEA, with red bars continuing to expand, indicating that short-term rebound momentum is indeed releasing, but the Bollinger Bands have narrowed and flattened, with prices running near the middle band, upper band pressure at $74,150, and lower band support at $73,060, compressing the volatility space to less than a thousand points.
The essence of this technical structure is: the rebound has momentum but lacks space. The weak rebound strength on the four-hour level is limited, with dense moving average resistance above, making it difficult to change the oscillating pattern in the short term. More critically, if this small cycle rebound fails to gain support from the daily trend level, it is likely to evolve into a 'continuation of decline' rather than a 'trend reversal.'
A common mistake traders make is to amplify short-term rebound signals as a basis for bottom fishing in the long term. The expansion of the red bars on the four-hour chart pales in comparison to the contraction of the green bars on the daily chart—one is the surface, the other is the direction.
4. Key threshold: The Fibonacci game at $73,869.
Currently, there is a 'magic number' marked by the consensus of most analysts: $73,869.
This is the 0.236 Fibonacci retracement level that Bitcoin recently lost during its decline, also a critical dividing line for the comparison of bullish and bearish forces. The logic of technical analysis is that if it can reclaim this level at the three-day close, it means the bears have lost control of the short-term trend, and prices may advance towards the structural resistance at $77,877 for three days, challenging the upper edge of the ascending channel at $82,785—where it previously rejected bulls in early May.
Conversely, if $73,869 continues to be lost, the lower channel trend line at $70,342 comes into view. If this level is broken, the 0.382 Fibonacci level at $68,348 will be exposed, representing over 7% downside from the current price. Deeper support is at $63,886 and $59,424, and if the 100-period and 200-period EMAs form a death cross, it may accelerate movement towards these areas.
For the current quote of $73,500, the market is in a sensitive zone of 'one foot away.' To the upside, a breakthrough of about $400 is needed for the technical threshold; to the downside, it faces layers of progressive support tests. This 'difficulty both ways' equilibrium is a typical feature before a trend change.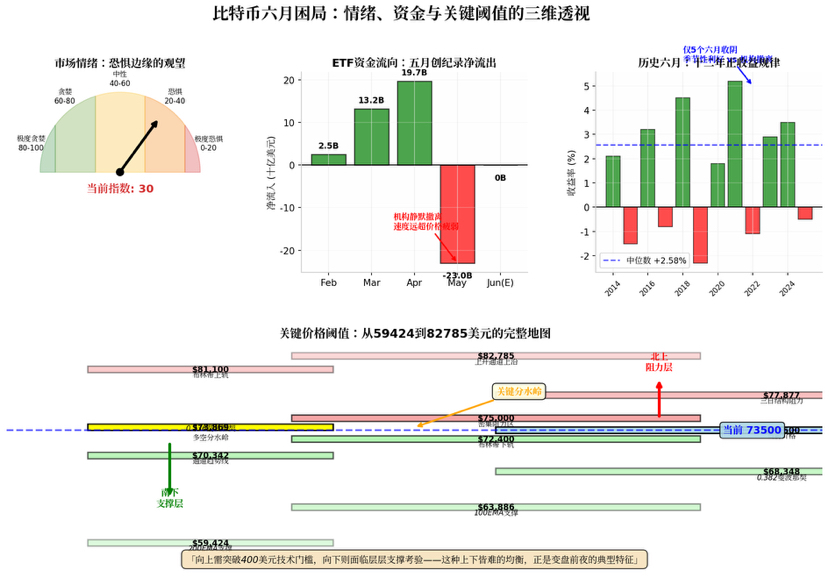
5. Macro variables: The cross-influence of June's FOMC and ETF fund flow.
Technical charts do not exist in isolation; two macro events in June will significantly impact the price path.
The Federal Reserve's June meeting is scheduled for June 16-17, and the current pricing of federal funds futures shows a 98.1% probability of maintaining the rate at 350-375 basis points. The uncertainty of interest rates exerts a hidden pressure on institutional risk appetite—once the uncertainty is removed, even if the outcome meets expectations, capital may flow back into risk assets. Bitcoin's sensitivity to liquidity expectations often leads to volatility spikes around the meeting.
ETF fund flow is a more immediate temperature gauge of sentiment. The $2.3 billion net outflow in May reversed the inflow trend of the previous two months (April $1.97 billion, March $1.32 billion). If the redemption speed slows down or shows net inflow reversal in early June, it will provide fundamental fuel for technical rebounds; conversely, continuous outflow will counter seasonal historical patterns and increase the likelihood of closing in the red in June.
Moreover, the Fear and Greed Index is currently near 30, on the edge of 'fear'—this reading suggests that most retail traders have stepped back to observe, and the absence of this group often means exhaustion of short-term selling pressure, with deep buying being taken up by large participants who are less sensitive to noise. This is not a bullish signal, but it hints that downside potential may be limited.
6. Strategy: Look for high-risk-reward ratios between trends and oscillations.
Based on the above multi-cycle analysis, the optimal strategy for the current market is not to predict turning points but to define boundaries and look for high-risk-reward trading opportunities within those boundaries.
Northward strategy (long): Align with the short-term repair momentum in the larger cycle, setting up long positions in the range of $73,200 to $72,700, with a stop-loss set at $72,200—this position is below the four-hour lower band, and if broken, it suggests a failed weak rebound, with prices likely accelerating to the downside. The target range is set at $74,500 to $75,000, where the four-hour upper band and dense moving average resistance are, making it a reasonable endpoint for short-term rebounds. The risk-reward ratio is about 1:2 to 1:3, fitting the fast in-and-out logic of short-term trading.
Southward strategy (short): Set up short positions in the range of $74,500 to $75,000, with a stop-loss set at $75,500. If this position is broken, it indicates that the short-term rebound strength exceeds expectations and may test higher resistance. The target range looks back at $74,000 to $73,000, returning to the oscillation center. The core of this strategy is 'follow the big trend, counter the small trend'—shorting on exhaustion as the price rebounds to resistance, instead of chasing shorts.
Both strategies share a common premise: strict stop-losses and small positions for trial and error. The current market is at a critical point of directional choice, and any unilateral bets face the risk of being washed out. There may be delays in article publication, and specific operations should rely on real-time market data; the above suggestions are for technical discussion only, and risks are self-borne.
7. When will the turning point appear: Time window and signal confirmation.
Regarding the core question of 'when will the turning point appear,' the answer lies in three time dimensions.
Short-term (1-3 days): Focus on whether the three-day close can recover $73,869. This is the first technical threshold that directly determines whether the bearish pattern loosens.
Mid-term (1-2 weeks): Observe whether the ETF fund flow shows reversal in early June, and whether the price can stabilize above $75,000 and break through the key resistance zone of $77,500-$78,000—this zone was a support level for several weeks, and once broken, it turns into strong resistance, making recovery much harder than ordinary technical levels.
Long-term (full month): After the FOMC meeting on June 17, the clarity of the interest rate path will improve. If combined with ETF fund inflows, it could create a 'macro + micro' dual resonance, pushing prices to test above $82,000; conversely, if institutions continue to withdraw and the macro environment does not improve, the historical positive return pattern of June may be broken, with prices seeking support below $70,000.
Turning points are never predicted; they are confirmed. For traders, instead of guessing the timing of turning points, it is better to prepare for responses to them—maintaining flexibility within the $73,200 to $75,000 oscillation range, respecting stop-losses, and waiting for the market to provide the final answer through volume and structural breakthroughs.
Conclusion: Bitcoin at $73,500 stands at a crossroads between seasonal bullishness and institutional withdrawal, caught in the fissures of a four-hour rebound and daily pressure cycle. The sevenfold returns of the first half of the year contrast with the frustration of retail investors, reminding us: when the trend is unclear, survival is more important than profit, and small stop-loss trial and error is more sustainable than high-stakes gambling. The June market does not belong to prophets but to pragmatic traders who are prepared with Plan A, Plan B, and even Plan C.


