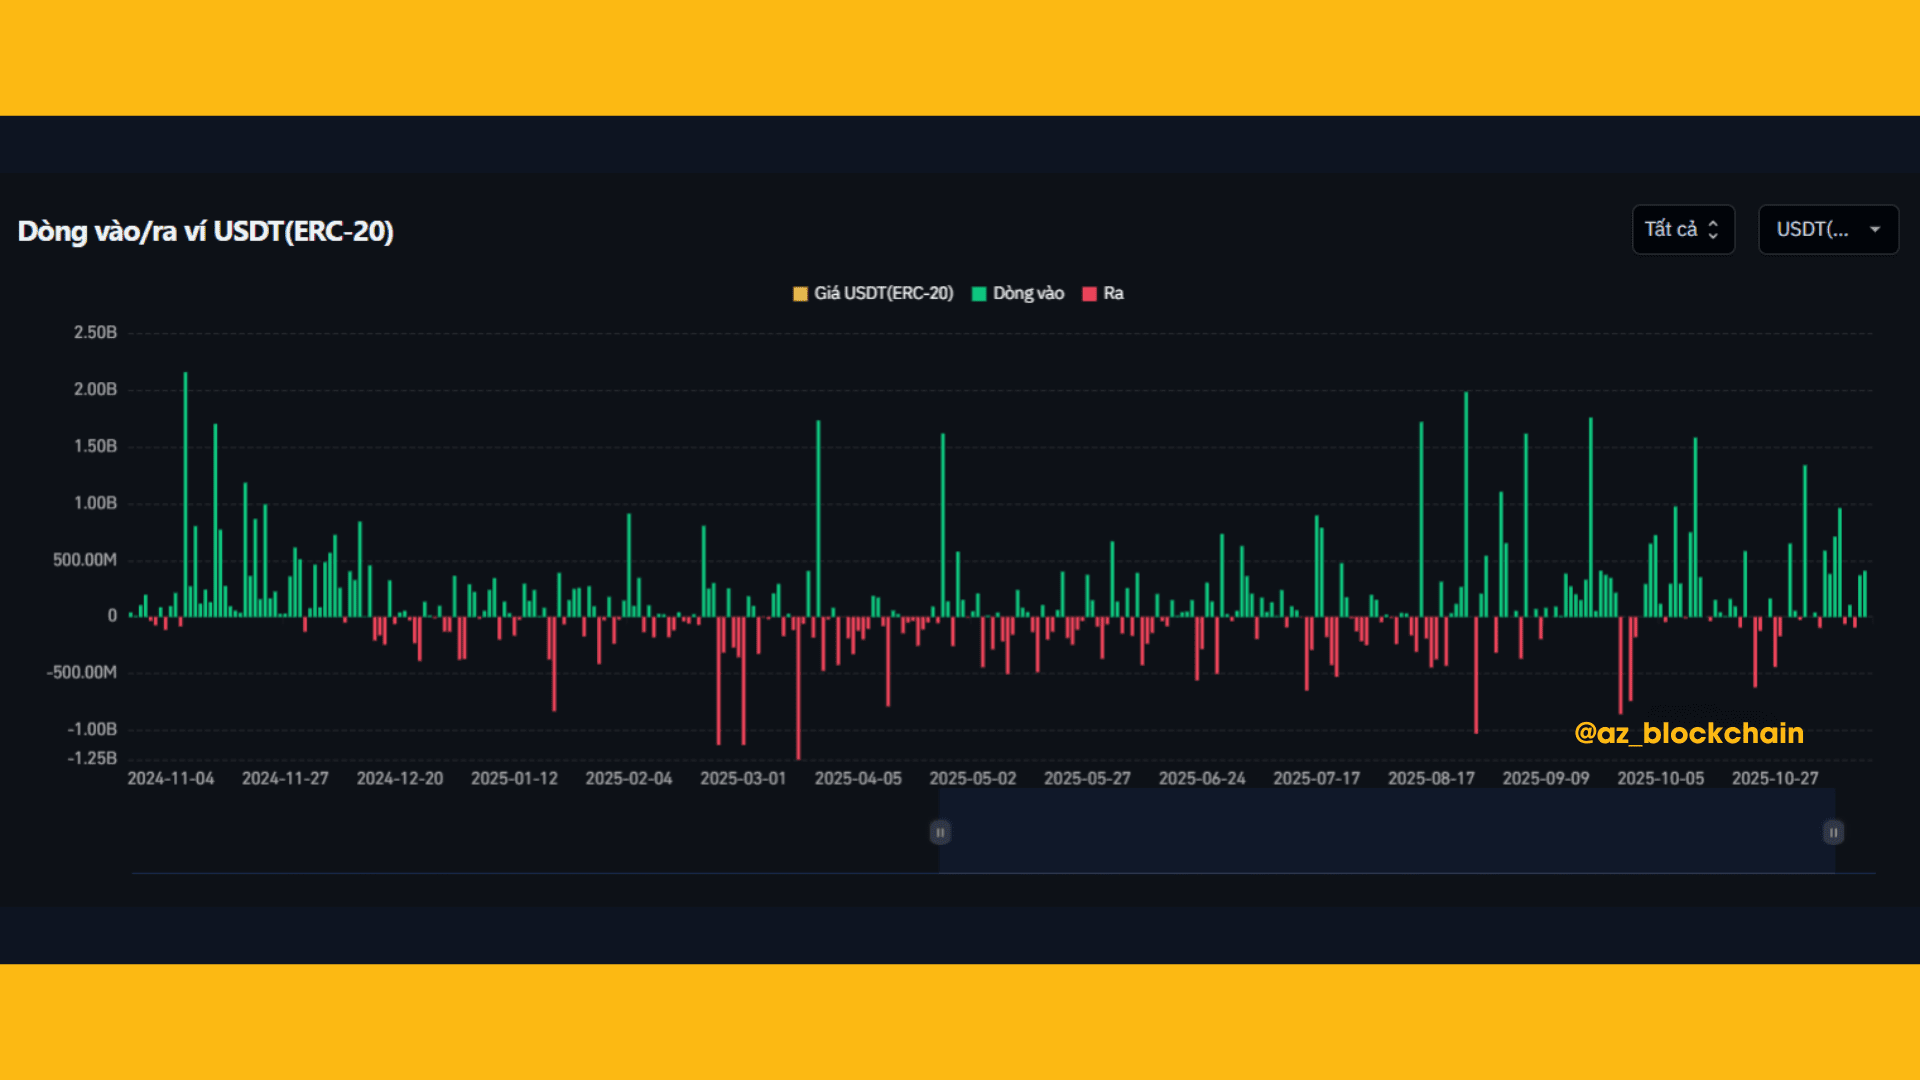
The USDT (ERC-20) inflow/outflow chart is an important tool to monitor the 'breath of cash flow' - a decisive factor for the strength of the crypto market.
🟢 1. Inflow (green) appears consistently with many large sessions
There are many tall green columns exceeding 500M – 2B USDT, indicating:
➡️ Investors are depositing money onto exchanges or wallets → preparing to buy crypto or participate in the market.
➡️ The mentality is to 'catch the bottom' or expect a retracement wave.

🔴 2. Outflow (red) is strong and interspersed, but not dominant
Some sessions saw withdrawals of over 1B USDT, but still lower than the large inflow periods.
➡️ This reflects profit-taking / leaving the market, but not the main trend.
⚖️ 3. The chart shows cash flow is quite balanced but slightly leans towards 'inflow'
➡️ This is a signal indicating that the market is not too pessimistic.
➡️ Players are still holding USDT to wait for opportunities instead of withdrawing completely from crypto.
🧭 MEANING FOR NEWCOMERS
✨Many USDT flowing in = there is money on the sidelines preparing to enter.
✨USDT is being withdrawn heavily = investors are fleeing the market.
💠In the current chart:
👉 The trend 'more money in than out' → the market is accumulating energy.
👉 This is a phase where short-term retracement waves or technical reactions of BTC & Altcoins are likely to occur.
💠Not a strong uptrend signal, but:
➡️ It’s not that the market is crashing — it is in a compression phase waiting for new momentum.
💡 STRATEGY SUGGESTIONS FOR NEWCOMERS
✨Hold smart stablecoins, waiting for a good price range.
✨Prioritize light DCA with $BTC and $ETH .
✨Avoid all-in or leverage during the phase of differentiated cash flow.

🛑 THIS IS NOT INVESTMENT ADVICE, PLEASE DO YOUR OWN RESEARCH AND STAY CALM IN THE MARKET. 😘
