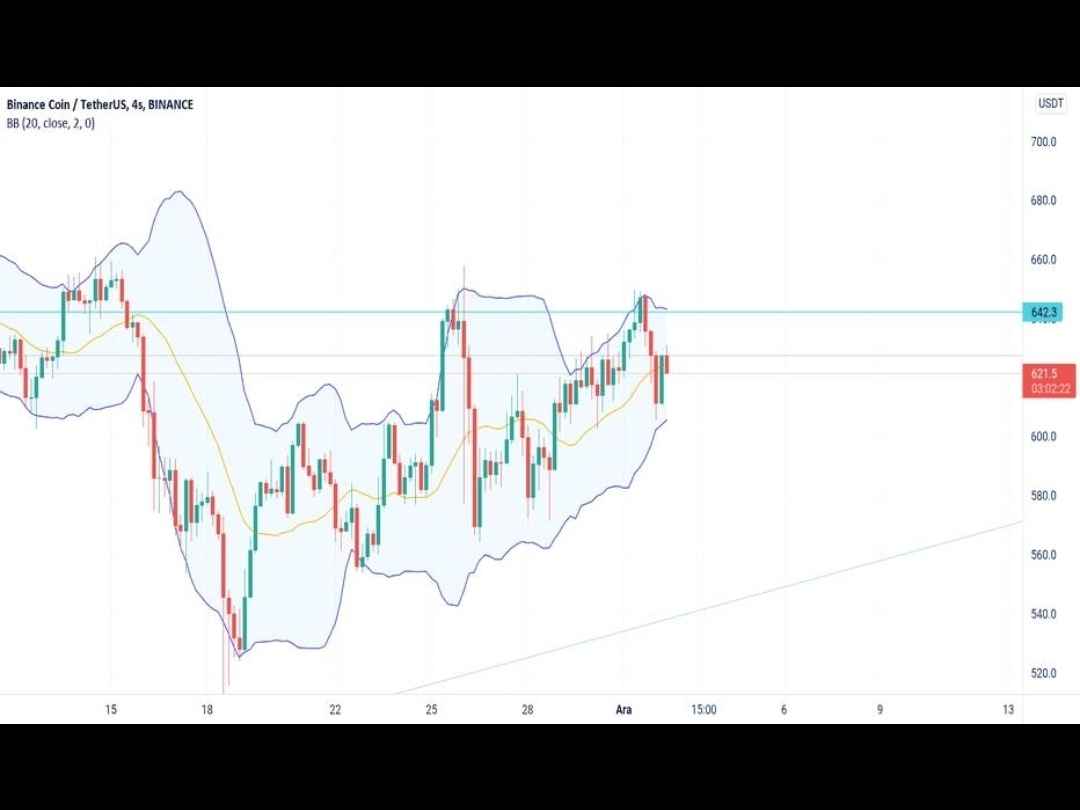
Simple analysis based on the chart (4-hour timeframe) but be careful: this is not a binding financial advice, just a professional trading scenario.
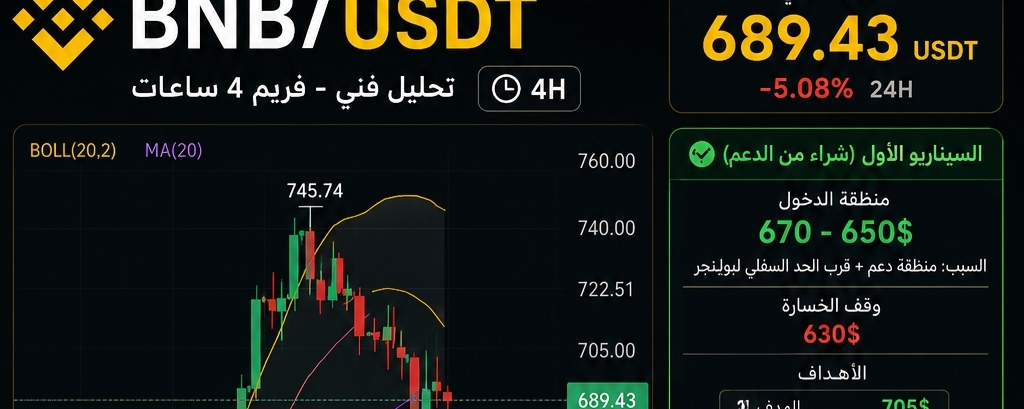
Current price: ~689$
Trend: Correction after a strong rally.
The price broke the resistance at $745 and has started a gradual decline.
Currently hovering around the Middle Bollinger Band.
RSI is around ~40 → close to the support zone (not fully oversold).
🎯 Entry and exit scenarios.
🟢 Scenario one (buying from support — best option)
Entry zone: 670 – 650$
Reason: support area + close to the lower Bollinger band
Stop loss: 630$
Targets:
🎯 Target 1: 705$
🎯 Target 2: 730$
🎯 Target 3: 750$
👉 This scenario is the safest (buying the dip)
🔵 Scenario two (breakout)
Entry: after closing a 4-hour candlestick above 705$
Stop loss: 680$
Targets:
🎯 730$
🎯 760$
👉 Suitable if bullish momentum returns
🔴 Negative scenario (breaking support)
If it breaks 650$ strongly
Expecting:
630$
Then 600$
❌ Here it's best to wait and not enter
⚠️ Important notes
Short-term trend: corrective
Overall trend: still bullish
Average trading volume → market is waiting for a decision
💡 Professional summary
> Best trade currently:
✔️ Gradual buy from 670–650
✔️ Or wait for confirmation of breakout at 705
#BNB #Crypto #Binance #
#TechnicalAnalysiss