#BTC A 71MIL📉. While the surface narrative attributes this drop to isolated events, a deep and multidimensional analysis (macro, technical, and on-chain data) reveals a much more complex liquidity restructuring 🧠.
1. 🌍 Macroeconomics and the Global Liquidity Filter
To understand the current movement, it's necessary to lift our gaze from the minute charts and observe the global macroeconomic map:
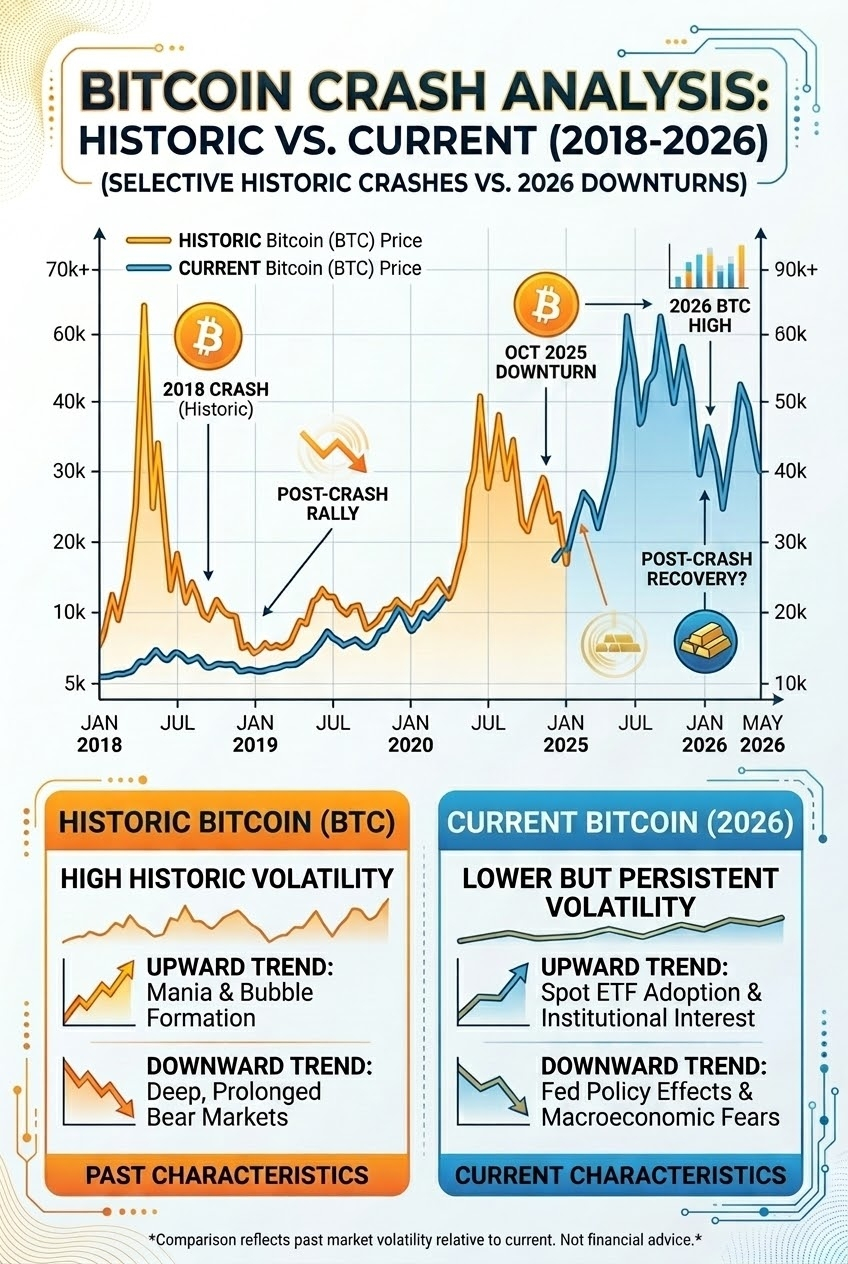
🟡 The correlation with Gold (92%): This data is key. Such a high correlation with gold is uncommon in retail euphoria phases; it indicates that $BTC is trading strictly as a macroeconomic safe-haven/liquidity asset 🏛️. When the global market goes into Risk-Off mode due to geopolitical tensions or pressures in the energy sector (oil), institutions tend to algorithmically liquidate positions to seek cash neutrality, dragging both gold and Bitcoin down temporarily.
🔄 Liquidity Injection Cycles: Corrections in this zone often coincide with periods of temporary contraction in central bank liquidity or expectations of sustained interest rates. The price does not fall due to a lack of value, but due to a temporary systemic drain of money in circulation 💸.
2. ⛓️ On-Chain Dynamics: ETF Flows vs. Silent Accumulation
Capital flow analysis allows us to separate noise from structural reality:
📉 The "Mirror Effect" of ETFs: Market data shows 10 consecutive days of net outflows, with IBIT leading a bleed of $142 million. Spot ETF flows represent short/medium-term institutional money (hedge funds, financial advisors) 🏦. This capital is highly sensitive to momentum and tends to capitulate quickly in the absence of new local highs.
🐳 The Illusion of MicroStrategy's Sale: The sale of 32 $BTC by Michael Saylor's company was the psychological trigger for panic. Structurally, it represented just 0.0038% of their reserves. That a $2.5 million sale can move a market of over $1.4 trillion confirms that the drop was driven by sentiment (FUD) and leverage, not by actual or organic selling pressure 🔍.
👤 Absorption in the Shadows: While the visible flow of ETFs is negative, historical on-chain data shows that these oversold windows are exploited by Whales (old native wallets) to accumulate through institutional OTC orders (over-the-counter), transferring supply from "weak hands" to "strong hands" 💼.
3. 📈 Fractal Analysis and Cycle Behavior
From a cycle theory perspective, pullbacks are the necessary fuel for trend continuity:
⚙️ Mid-Cycle Corrections: Comparing the current structure with fractals from previous market cycles, pullbacks of between 5% and 15% within a larger bullish channel are completely healthy 📈. They serve to reset volatility indicators and clear excess leverage (liquidation of long positions).
🛡️ Critical Support Levels: Technical support at $70,600 acts as a line in the sand. In Bitcoin's history, maintaining key rounded supports at high psychological figures consolidates a new price base (a "higher low"), which invalidates the hypothesis of a prolonged bear market and sets the stage for the next parabolic extension 🗺️.
📑 Structural Conclusion.
The current drop can be summarized as a psychological capitulation optimized by algorithms 🤖. The fundamental and institutional value of Bitcoin remains intact; however, the market is charging a "transfer fee" from emotional short-term investors to entities with long-term investment horizons ⏳. Technically, with indicators like the RSI at extreme oversold levels in short timeframes, the price seeks its optimal equilibrium point to exhaust available supply.