
🌟 Introduction
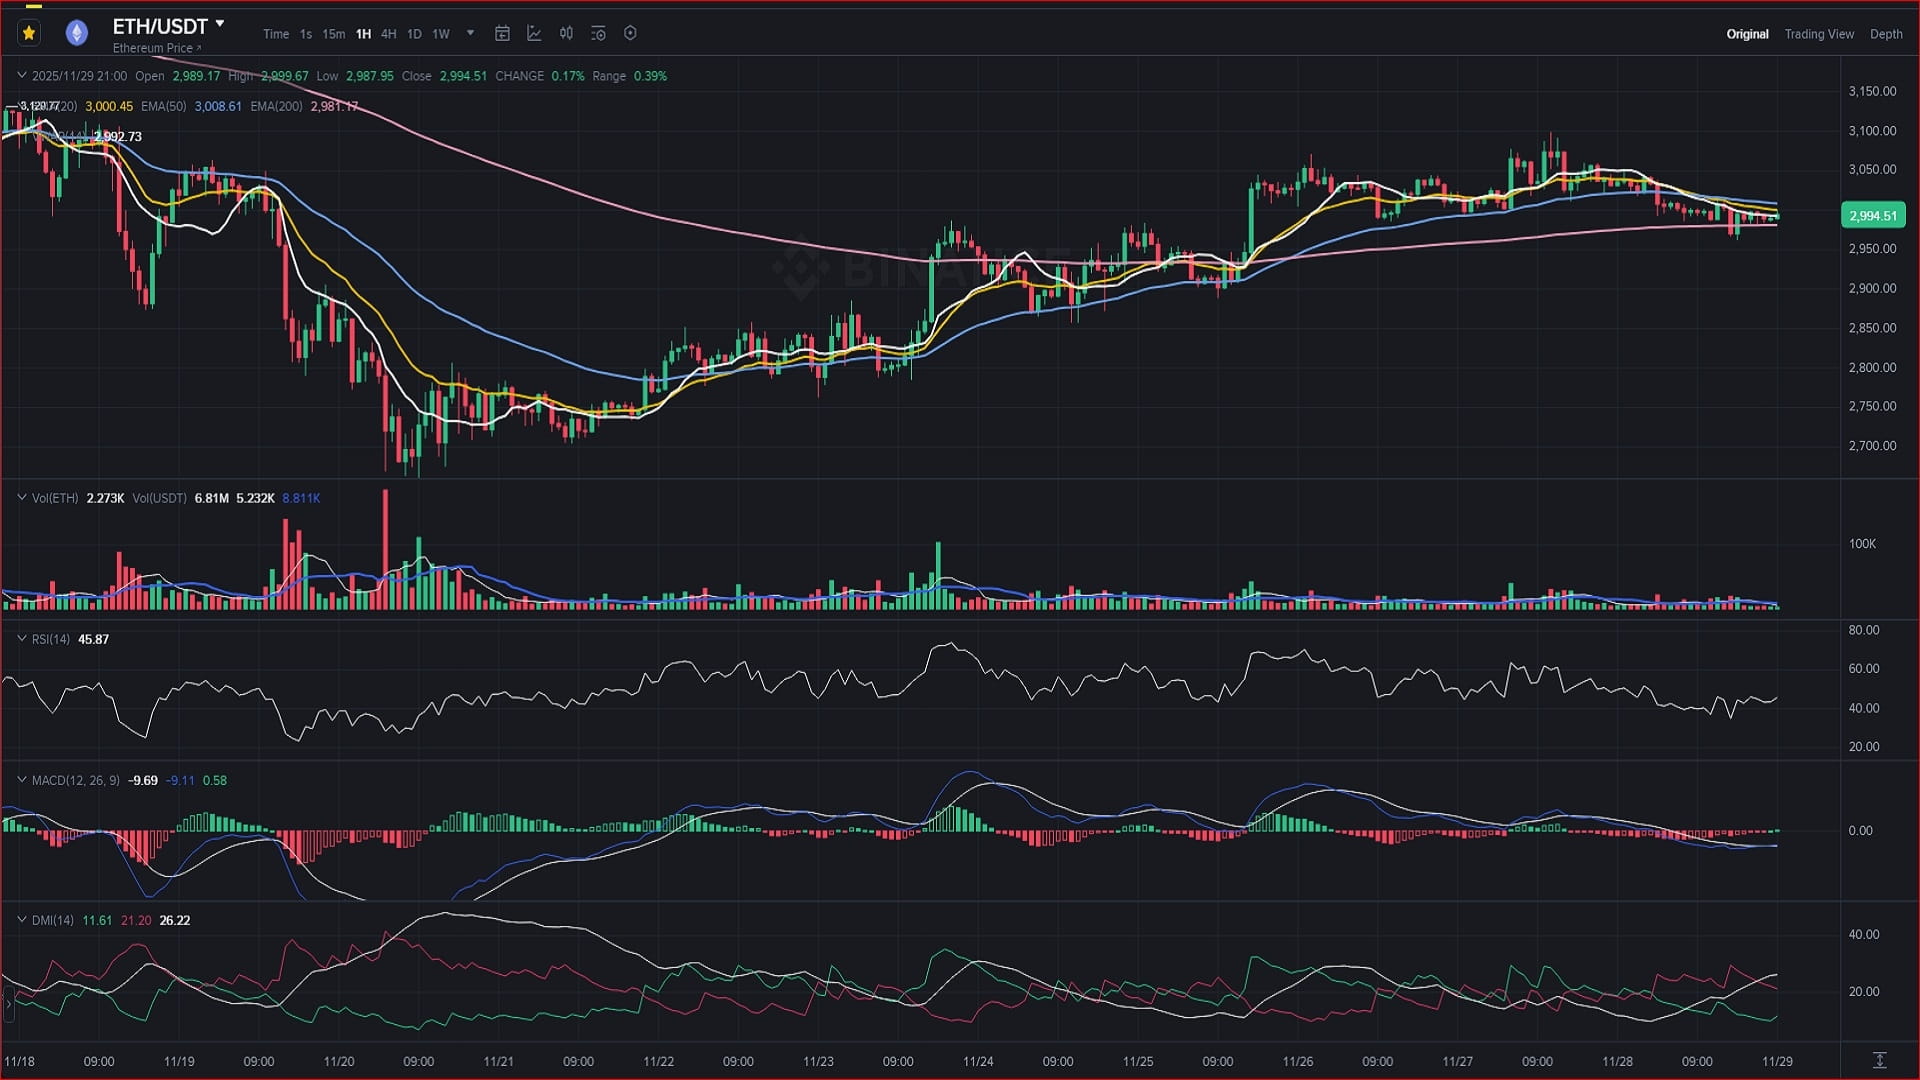
Asset and Time Frame: Ethereum (ETH/USDT) on a 1-hour (1H) chart.
Concise Summary: The price of ETH is in a key lateral consolidation phase after a bullish movement, struggling to find a clear direction near $3,000.
Purpose of the Analysis: We will examine the EMA, VWAP, RSI, MACD, and DMI indicators to determine the probability of a continuation breakout or a deeper correction.
🔍 Deep Technical Analysis
A. Price Action and Japanese Candles
Market Structure: ETH is trading in a narrow range, establishing a clear horizontal resistance level near $3,050.
Candlestick Pattern: Recent candles show small bodies and wicks indicating indecision by buyers and sellers, which is typical of an accumulation or distribution phase.
Key Levels: The area around $2,950 (where the EMA 200 crosses) acts as the most critical short-term support.
B. Exponential Moving Averages (EMA 20/50/200)
Short-Term Trend (EMA 20/50):
Positioning: The price is dancing around the EMA 20 (Yellow) and the EMA 50 (Cyan), confirming the lack of directional momentum.
Implication: This suggests that short-term traders are indecisive. The EMAs 20 and 50 are flattening, reinforcing the sideways movement.
Long-Term Trend (EMA 200 - Pink):
Definition: The price remains slightly above the EMA 200, which is serving as a strong and key dynamic support.
Relevance: As long as the price remains above the EMA 200, the overall (macro) outlook for this timeframe remains bullish, despite the current consolidation.
C. Relative Strength Index (RSI 14)
Current Reading: The RSI is in the neutral zone (around 50-55).
Condition: There are no signs of overbought or oversold conditions, supporting the thesis that the market is in a state of equilibrium of forces.
Divergences: No significant divergences are observed in the recent chart, so the indicator does not issue warning signals of imminent reversal.
D. Volume Weighted Average Price (VWAP 14)
Positioning: The price is constantly crossing the VWAP (White).
Implication: This underscores that most volume-weighted trades during this period have been executed exactly at the current price. There is no clear bias towards accumulation or distribution based on volume.
E. Moving Average Convergence/Divergence (MACD)
Histogram State: The histogram shows very small bars, oscillating between positive and negative.
Line Cross (DIF Blue vs. DEA White): Both lines are crossing and compressing near the zero line.
Implication: This is the clearest signal that directional momentum has faded. The MACD indicates that trend strength has temporarily exhausted, waiting for a catalyst to move.
F. Directional Movement Index (DMI 14)
Trend Strength (ADX - White): The ADX is at low levels (around 20 or less).
Implication: Confirms the lack of a strong trend. The current trend (sideways) is weak.
Trend Direction (+DI Green vs. -DI Fuchsia): The +DI and -DI lines are very close to each other, with neither having a clear advantage. Implication: The struggle between bulls and bears is at its peak.
🎯 Perspective and Trends
Conclusion Summary: The composite technical analysis points to strong consolidation. Although the long-term trend (EMA 200) remains bullish, short-term momentum has dried up. The market awaits a breakout.
Bullish Scenario (Thesis):
ETH needs a decisive 1H candle close with volume above $3,050.
This could quickly lead the price to test the next resistance in the range of $3,100.
A successful breakout would be confirmed by the ADX rising above 25 and the MACD crossing upward with a growing histogram.
Bearish Scenario (Anti-Thesis):
A drop and 1H candle close below the EMA 200 support (approximately $2,950) would invalidate the bullish thesis.
This would open the door to testing lower support levels, possibly towards $2,900 and even $2,850.
Key Levels to Watch:
Critical Resistance: $3,050
Critical Support / Invalidity Level: $2,950 (EMA 200)
$ETH #Ethereum #TechnicalAnalysis #TradeNTell #EMA200 #CryptoAnalysis
⚠️ Disclaimer:
This analysis is purely educational and is based on technical data from the provided chart. It does not constitute financial, investment advice, or a recommendation to buy or sell under any circumstances. Investing in cryptocurrencies carries significant risks. Always do your own research (DYOR) and trade at your own risk.
