1. Overall Summary:
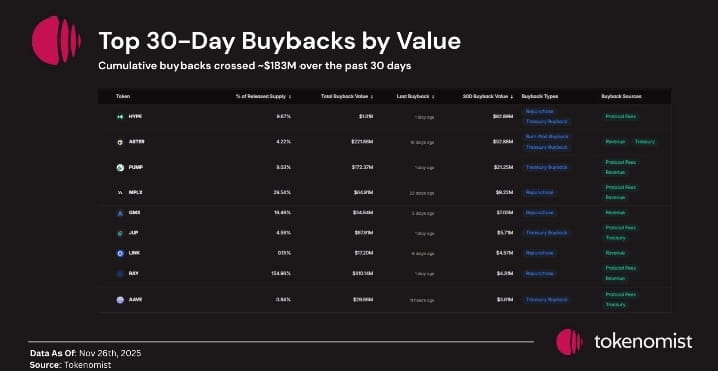
· Time Period: Past 30 days (with data until November 26, 2025).
· Total Activity: The total value of these buybacks was approximately $163 Million, indicating significant market activity.
· Focus: Preparing a list of companies that are buying back their shares (buyback), which is a strong signal of the leadership's confidence in their own stock.
2. Key Metrics and Their Meaning (Key Indicators and Their Explanation):
The table contains several columns, some of which are understandable:
· Name: The company's name (Here placeholders are shown like "1", "2", etc.).
· % of mcap (% of Market Capitalization): This shows what percentage of the company's total market value was involved in the buyback. Figures like 2.0% or 3.0% indicate a substantial commitment over a month.
· Total Buyback Value: The total monetary size of the buyback program (Here values like 3,000% seem incorrect, it should probably be $30.00M or something like that).
· 2025 Purchase Value: It seems to indicate the total buyback value year-to-date (2025), putting this 30-day activity in a broader context.
· Buyback Type: This indicates what was done with the shares. Two main types are shown:
· Treasury/Retired: Shares have been permanently canceled, which increases the ownership stake of remaining shareholders.
· Non-custodied/Retired: This seems to be a technical term that possibly has a specific meaning in the crypto or digital asset space, but generally it also means that shares have been retired.
· Buyback Method: This indicates how the company purchased shares. Two methods are shown:
· Financial Reserve: The company used its cash reserves or profits. This is a healthy sign.
· Revenue: The company directly purchased shares with its revenue. This is a very aggressive strategy that reflects the company's strong cash flow.
3. Key Trends and Inferences:
· Aggressive Capital Return: Companies are returning a large portion of their earnings/cash to shareholders, suggesting that they consider their stock undervalued rather than investing for growth.
· Confidence Signal: Executing buybacks reflects management's confidence in the company's future performance.
· Use of Both Methods: The report indicates that companies are utilizing both financial reserves and directly revenue for buybacks, demonstrating their financial flexibility and capacity to take risks.
4. Data Limitations:
· Garbled Data: Column headers like Lunch/$(xg/m) and values like 0.00 AMH have no clear meaning. This reduces the accuracy of the analysis.
· Missing Company Names: Without actual company names, this report only shows a general market trend and cannot analyze the performance of specific companies.
5. Conclusion:
This report reflects a very active share buyback market over a 30-day period until November 2025. Companies are using their strong financial position to repurchase their shares, suggesting a bullish market sentiment. Despite some parts of the data being unclear, the overall picture is that capital return strategies are being utilized and company managements are confident about their stock's future.