How to read candles in trading (Japanese candles)
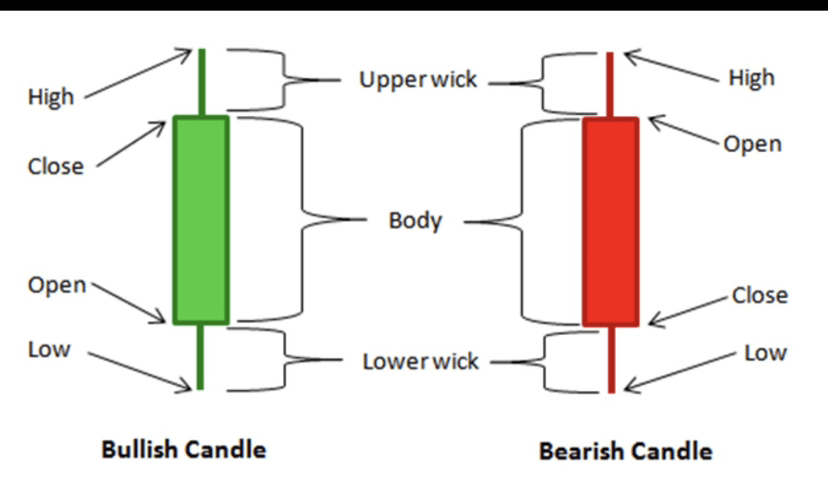
🔥 First: Components of the candle
Each candle represents a struggle between buyers and sellers over a period of time (1m, 5m, 1h, 4h, daily…)
• The body: The difference between the opening and closing price.
• The wick: The highest and lowest price reached during the period.
• The color:
• 🔴 Bearish candle: The close is less than the open.
• 🟢 Bullish candle: closing above opening.
Small timeframe = more noise
Large timeframe = higher signal strength
⸻
📈 Secondly: What does the candle tell you?
🟢 Long bullish candle
• Strong buyers' control.
• Buying momentum → possibility of continued rise.
🔴 Long bearish candle
• Strong sellers' control.
• Selling momentum → possibility of continued decline.
🤝 Small body candle + long tails
• Indecision / struggle (Indecision).
• Pay attention to the surrounding areas (Resistance/Support).
⸻
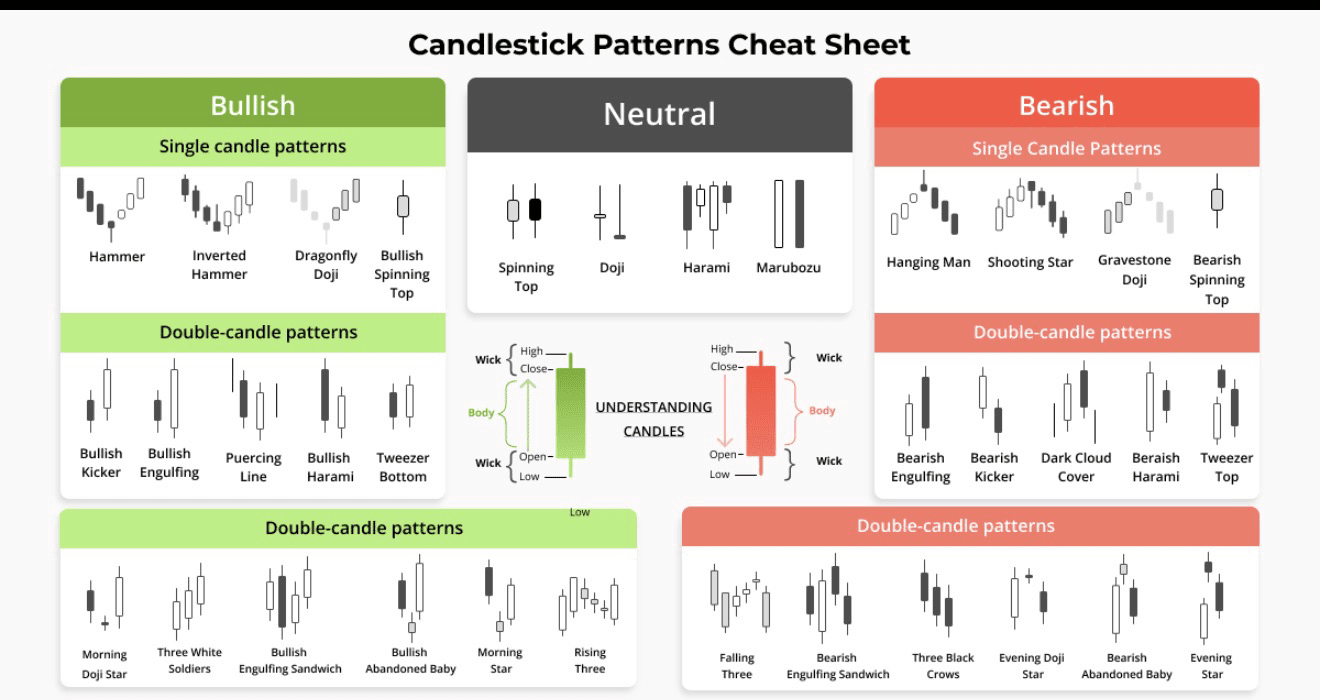
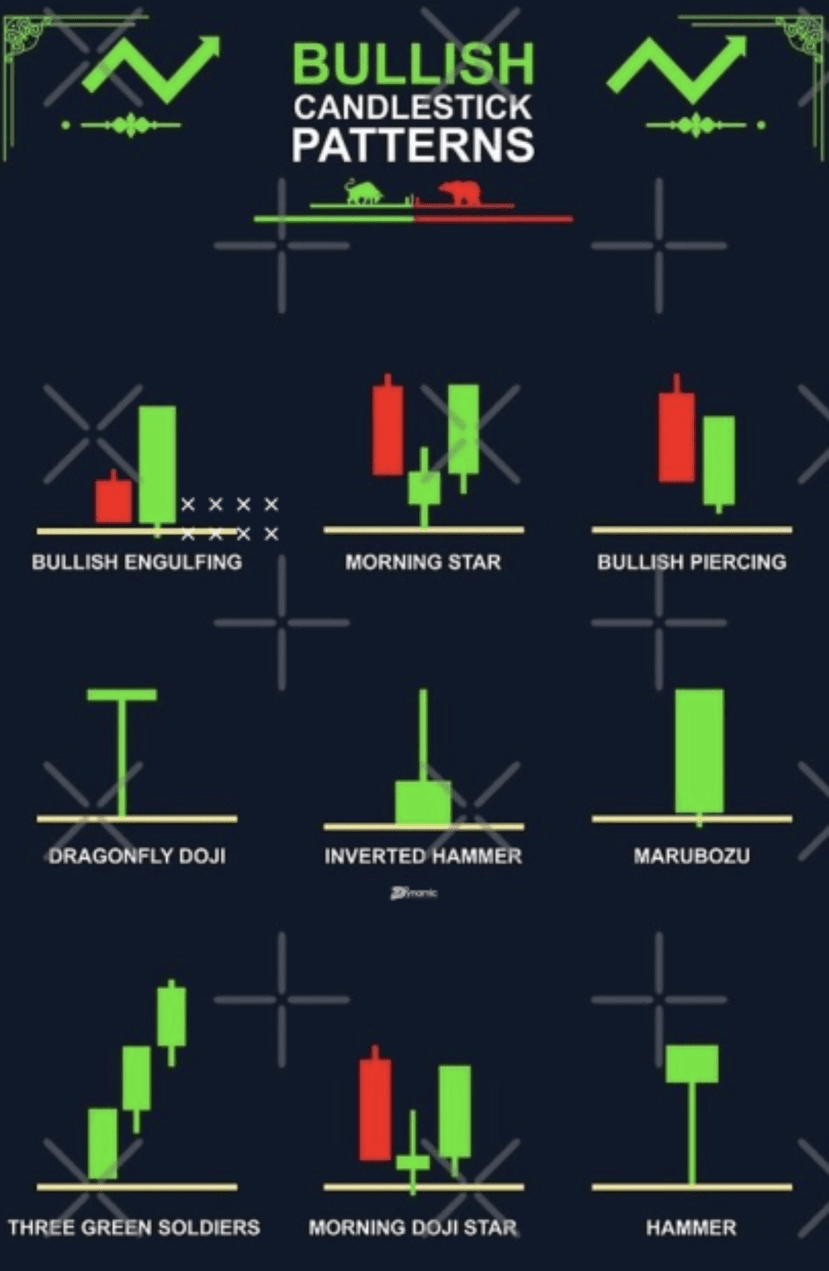
📌 Thirdly: Basic candlestick patterns (Bullish & Bearish)
🟢 Bullish Engulfing — Bullish engulfing
• Large green candle engulfs the previous red one.
• Upward reversal signal at the bottom.
🔴 Bearish Engulfing — Bearish engulfing
• Large red candle engulfs the previous green one.
• Downward reversal signal at the top.
🟢 Hammer — Hammer
• Long lower tail + small body above.
• Bounce indicator from support.
🔴 Shooting Star — Shooting Star
• Long upper tail + small body below.
• Rejection indicator at resistance.
⸻
🎯 Golden rule
Do not rely on one candle. Read the context:
• Where did the candle appear? (Support, Resistance, Trend)
• What timeframe? (Hourly ≠ Daily)
• How is the trading volume? (Volume)
Strong candle + important level + large timeframe = confirmed signal
⸻
Quick practical example:
• If a Hammer appeared on strong support in 4H timeframe
→ Logical spot entry after confirming the next candle.
• If a Shooting Star appeared on daily resistance
→ Selling/short opportunity with stop above the candle's tail.
#btc #بيتكوين #بينانس #الشموع_اليابانية $BTC