Based on the analysis of the data from the images, I can identify several reasons why XRP/USDT has had difficulty rising and staying above 2.20 during the day. Here are the key factors:
1. Strong supply pressure near 2.20
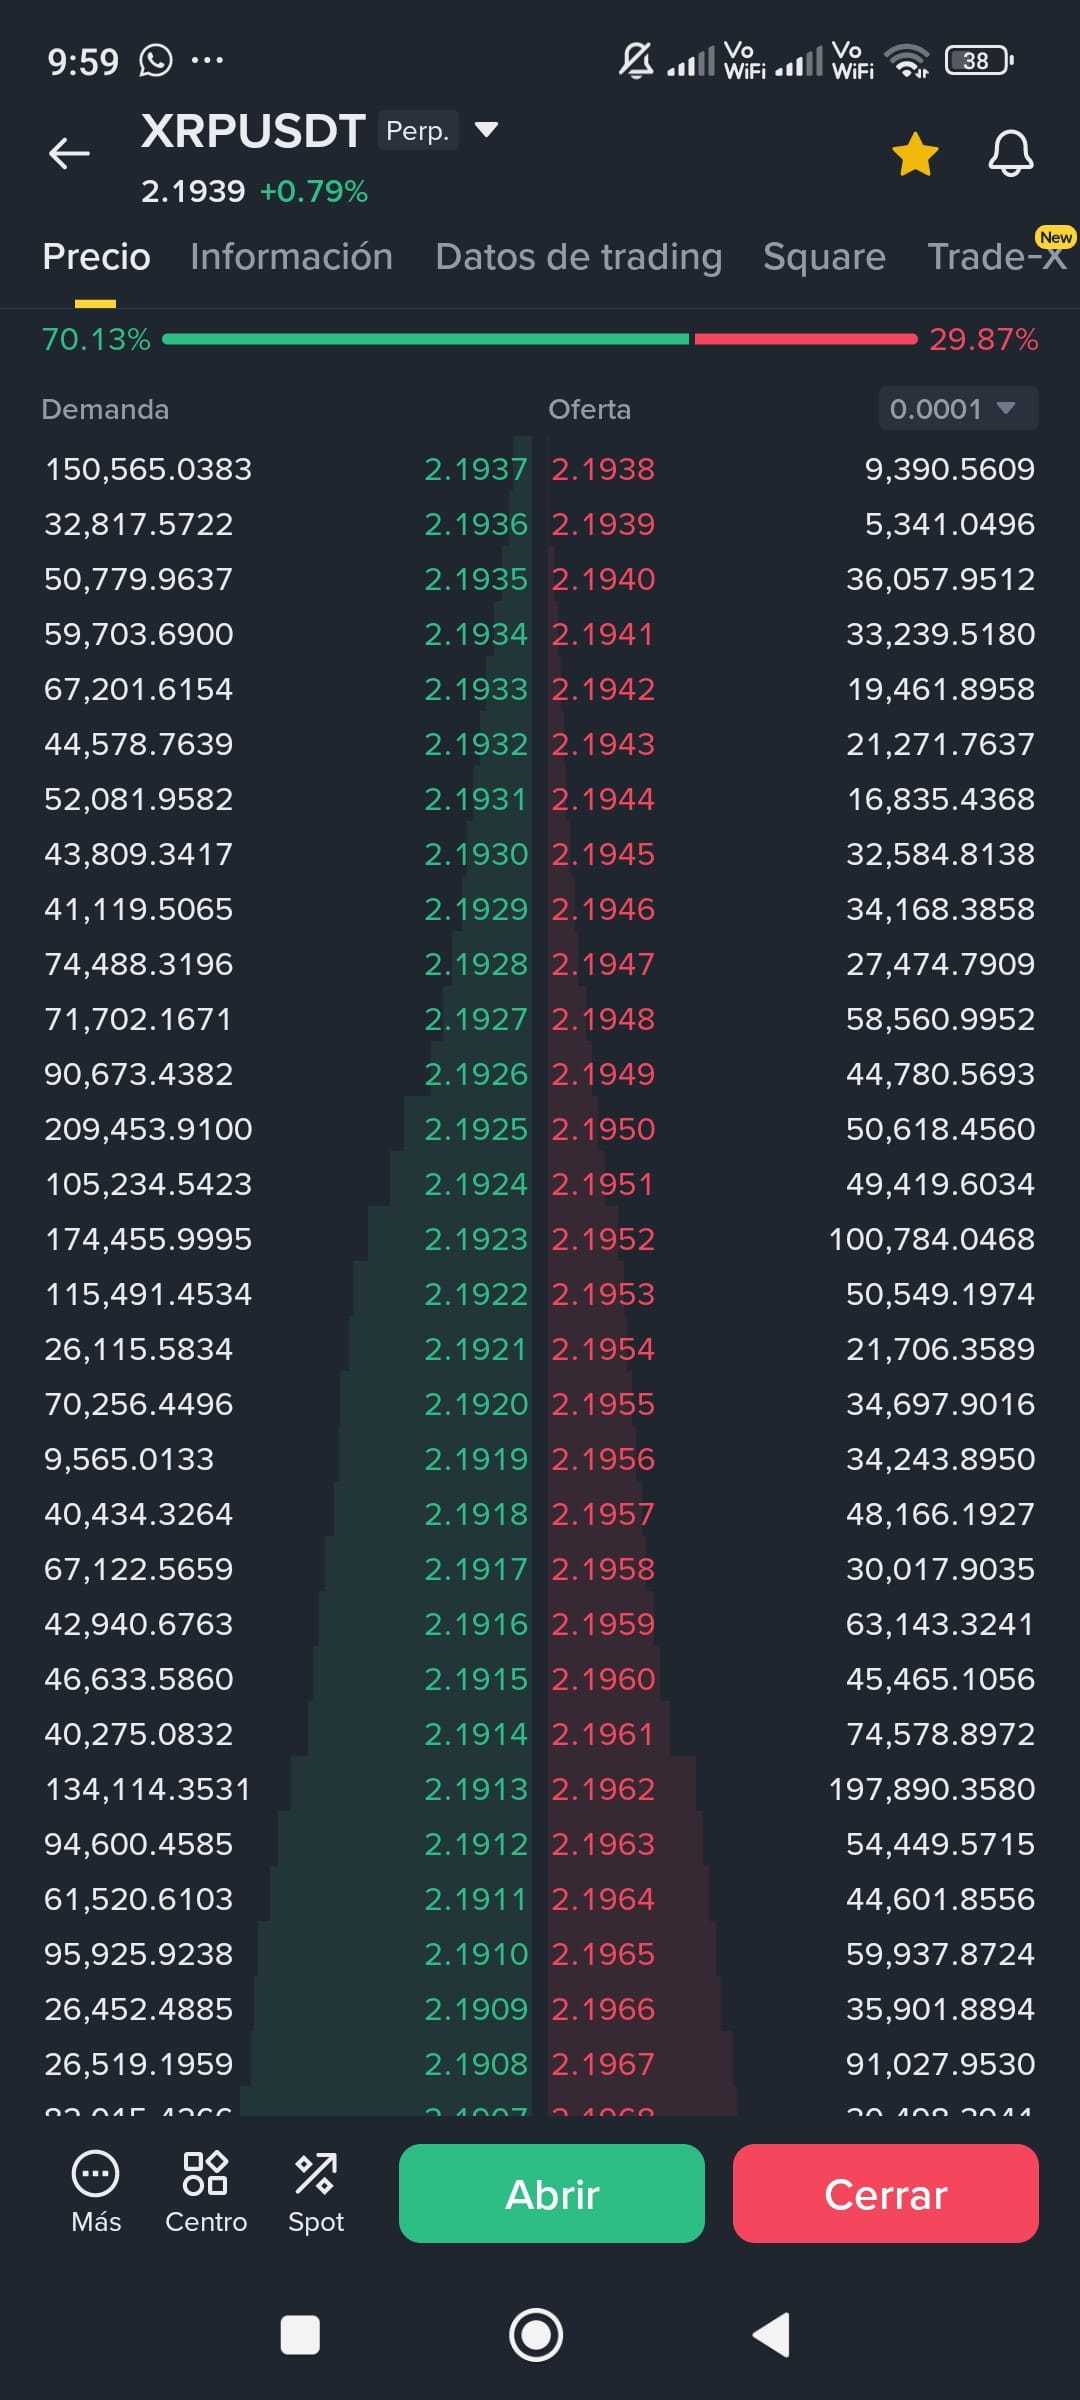
In the order depth table (first image), there is a clear concentration of sell orders (Supply) at price levels between 2.1940 and 2.1965.
For example:
· At 2.1960 there are 46,633 XRP for sale
· At 2.1965 there are 95,925 XRP for sale
This means that every time the price approaches 2.20, it encounters significant resistance due to these large accumulated sell volumes.
2. Lack of sufficient buying momentum.
On the demand side (buys), the volumes are large at lower levels (e.g. 150k XRP at 2.1937), but they are not strong enough to absorb all the supply present between 2.1940 and 2.20.
The mark price is 2.1938, suggesting that the market is operating slightly below the last price (2.1940), indicating seller pressure in real-time.
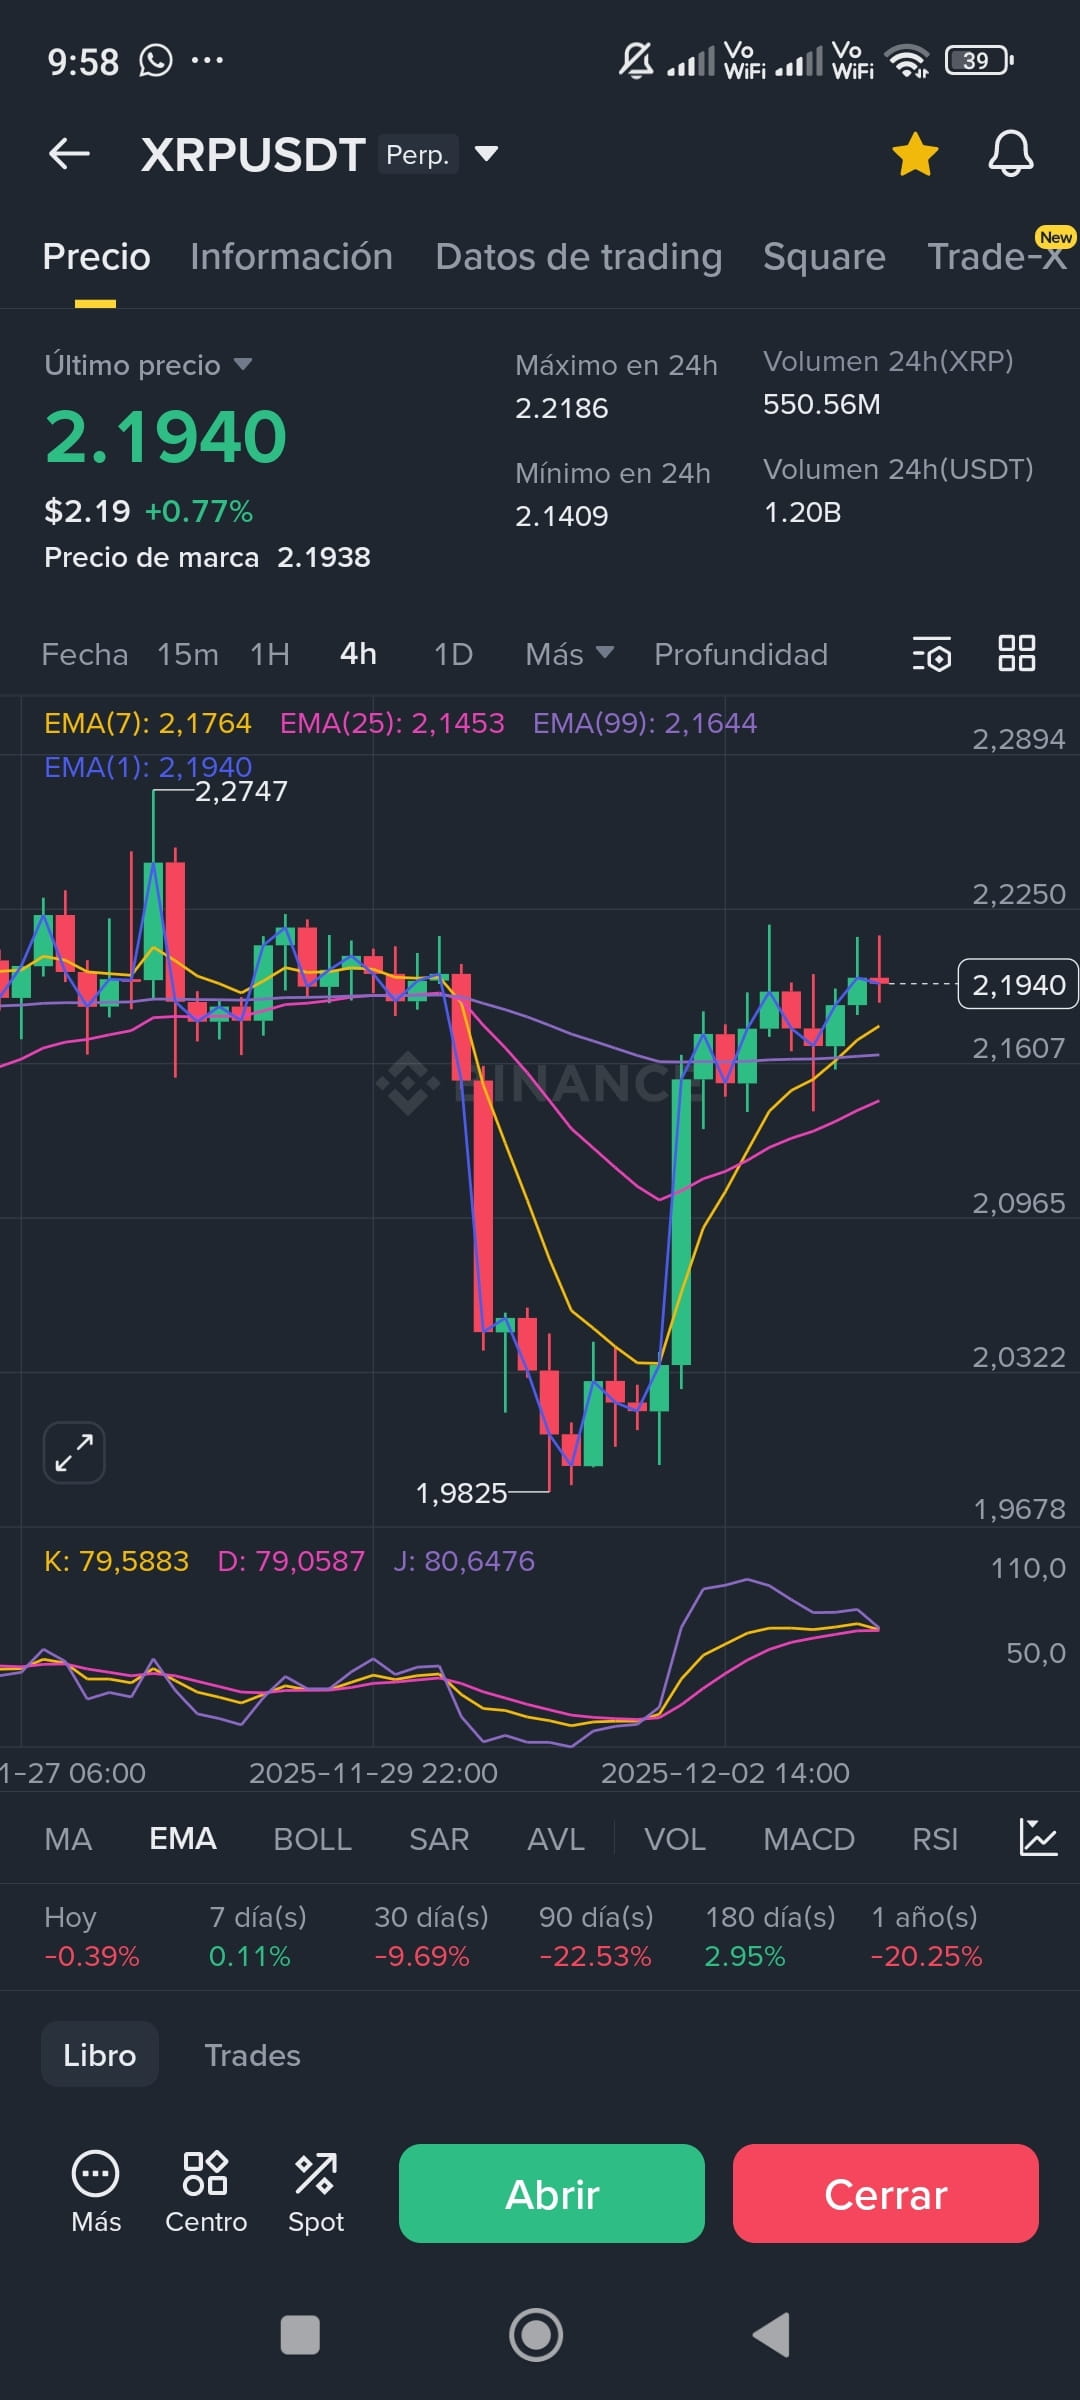
3. Technical indicators suggest a possible exhaustion.
In the second image:
· RSI (K: 79.59, D: 79.06, J: 80.65) is in overbought territory (above 70). This may cause buyers to become cautious and not push the price further.
· EMA(7): 2.1764 is below the current price, providing support, but EMA(25): 2.1453 and EMA(99): 2.1644 are lower, suggesting that the medium-term trend is not clearly bullish yet.
4. Volume and market context.
· The volume in 24h is high (550M XRP), but the price does not manage to break the key level (2.20).
· Performance data shows:
· Today: -0.39%
· Last 30 days: -9.69%
This indicates that the overall sentiment is not strongly bullish, and there are sales on rallies.
5. 24h high at 2.2186, but it could not hold.
The fact that the price already touched 2.2186 in the last 24h but fell back suggests that sellers are active in that area, and the level of 2.20 acts as a psychological and technical resistance.