Moving averages combined with candlesticks, first talking about moving averages, then talking about K.
Moving averages, moving averages, moving averages.
Share a wild trader friend A, whose capital went from six figures to nearly eight figures, using a moving average system.
Three models, a few mnemonics:
Mnemonic and model A (taking long as an example, doing the opposite for short).
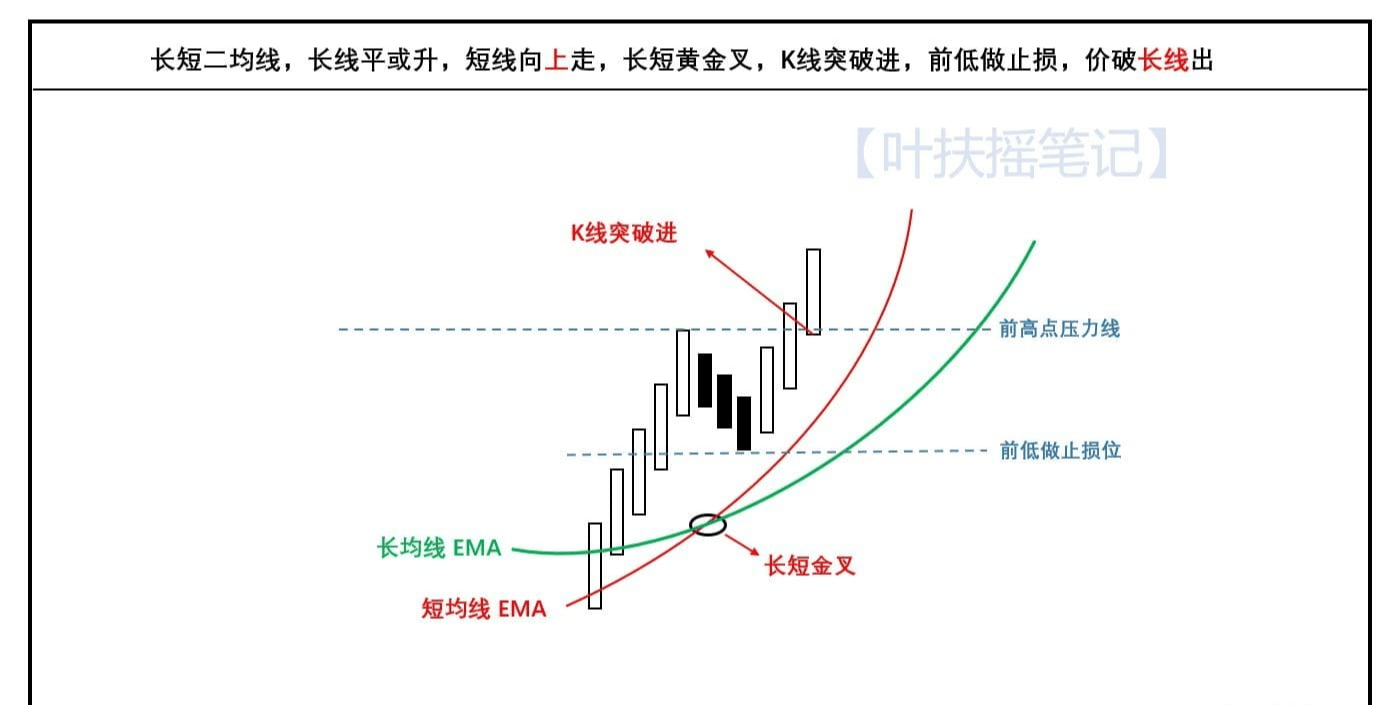
Long and short two moving averages, long line flat or rising.
Short lines going up, golden crosses between long and short.
K line breaks in, stop loss at previous low.
Price breaks the long line out!
Don't understand? The above image makes it clear!
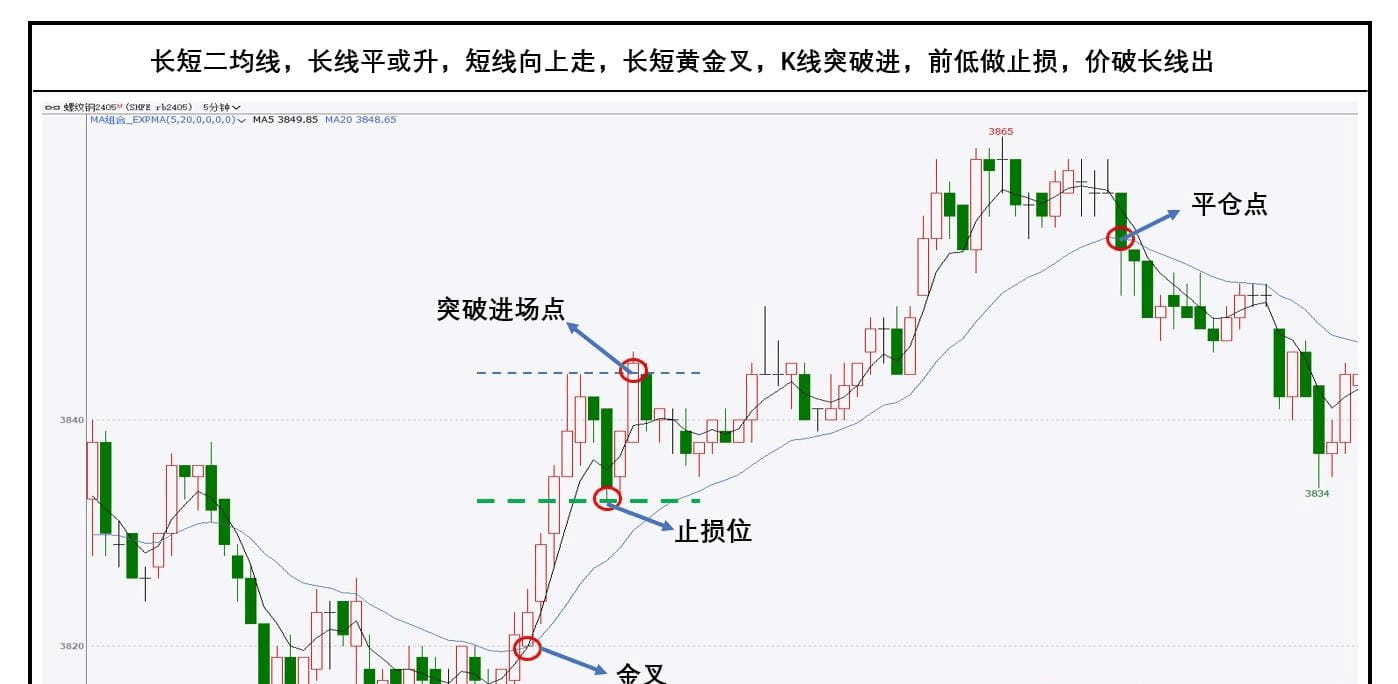
 The last two real trading charts.
a. [Rebar], 5M period:
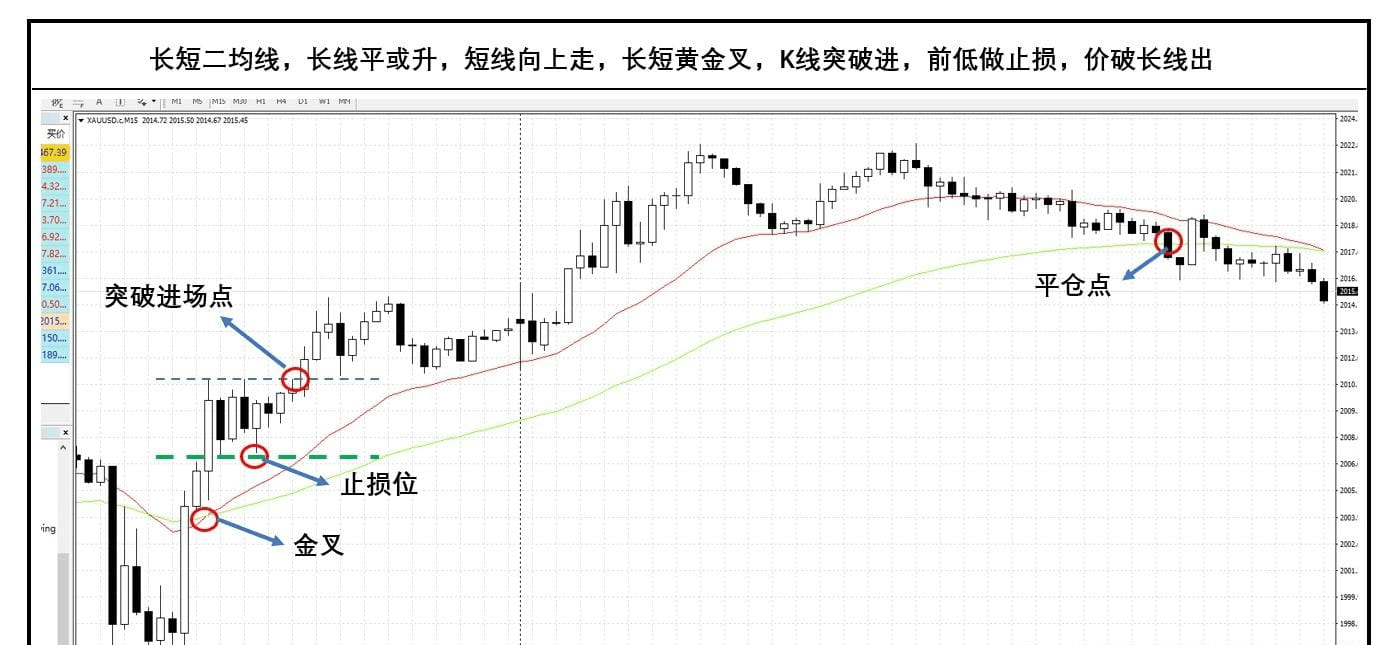
 b. [Gold XAUUSD], 15M period:
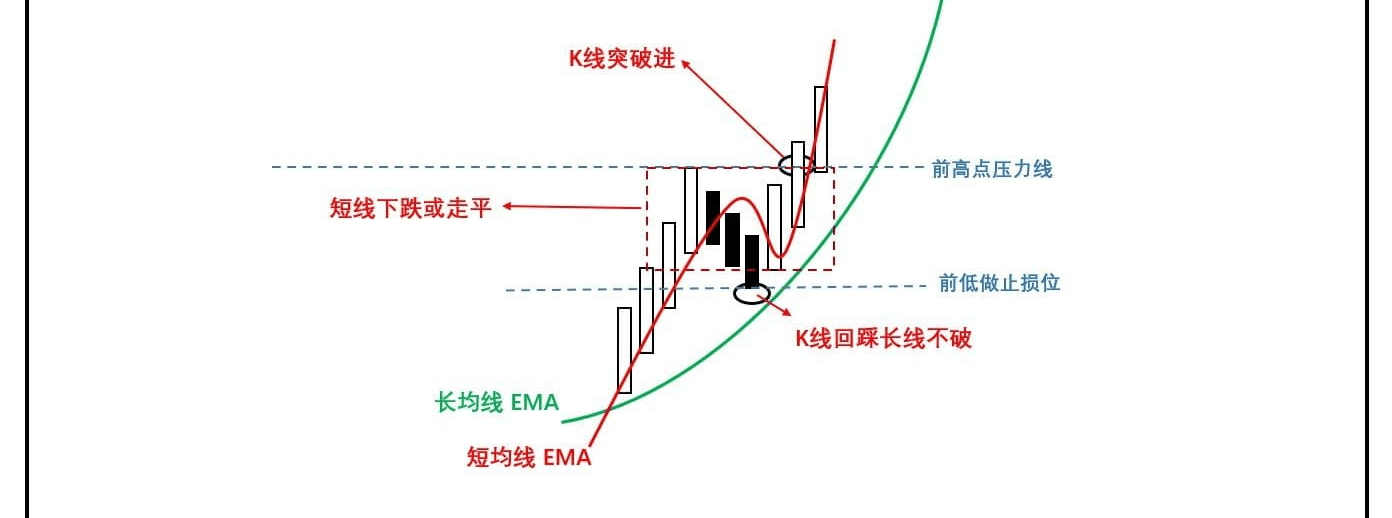
 Mnemonic and model B (taking long as an example, doing the opposite for short).
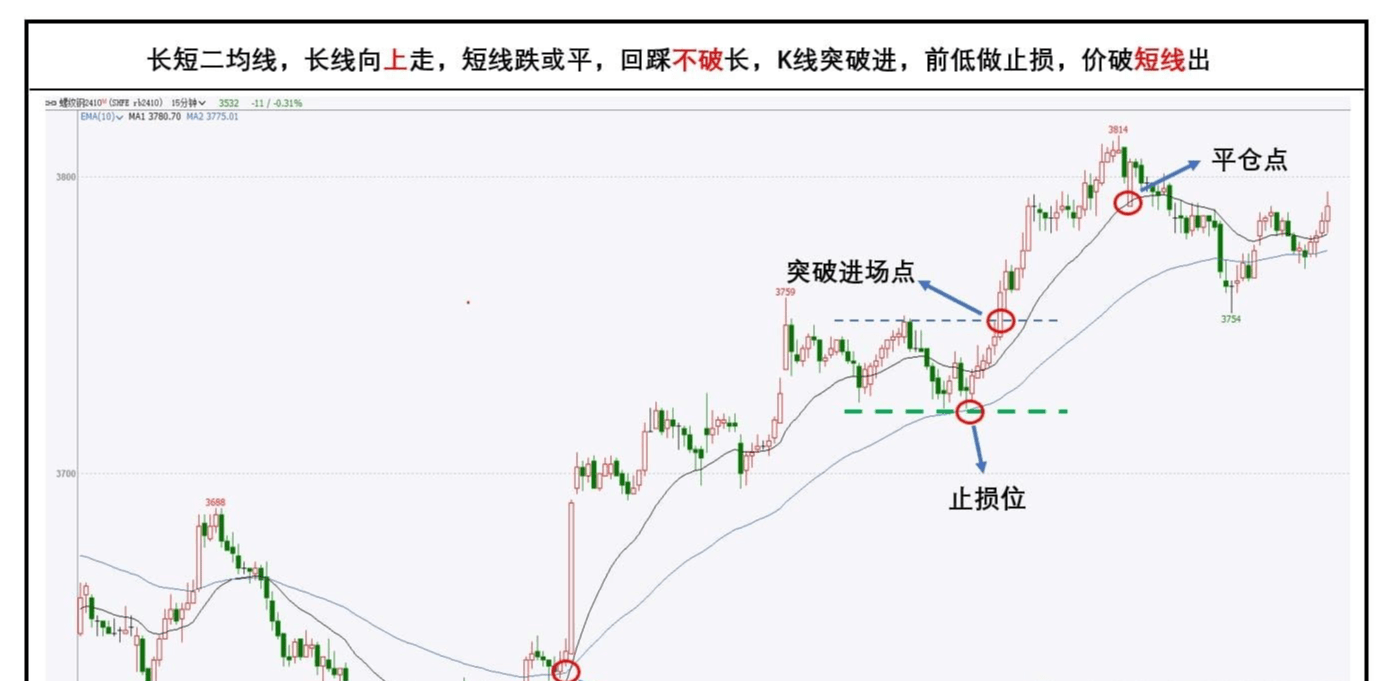
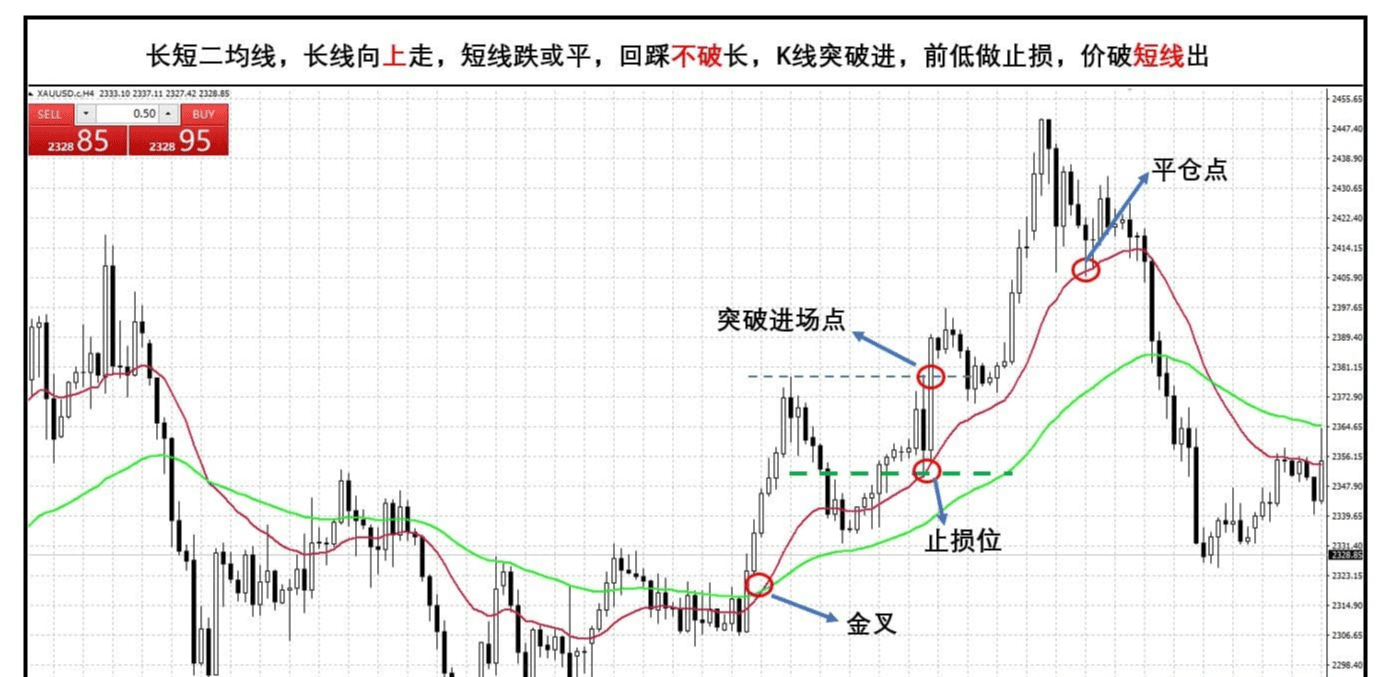
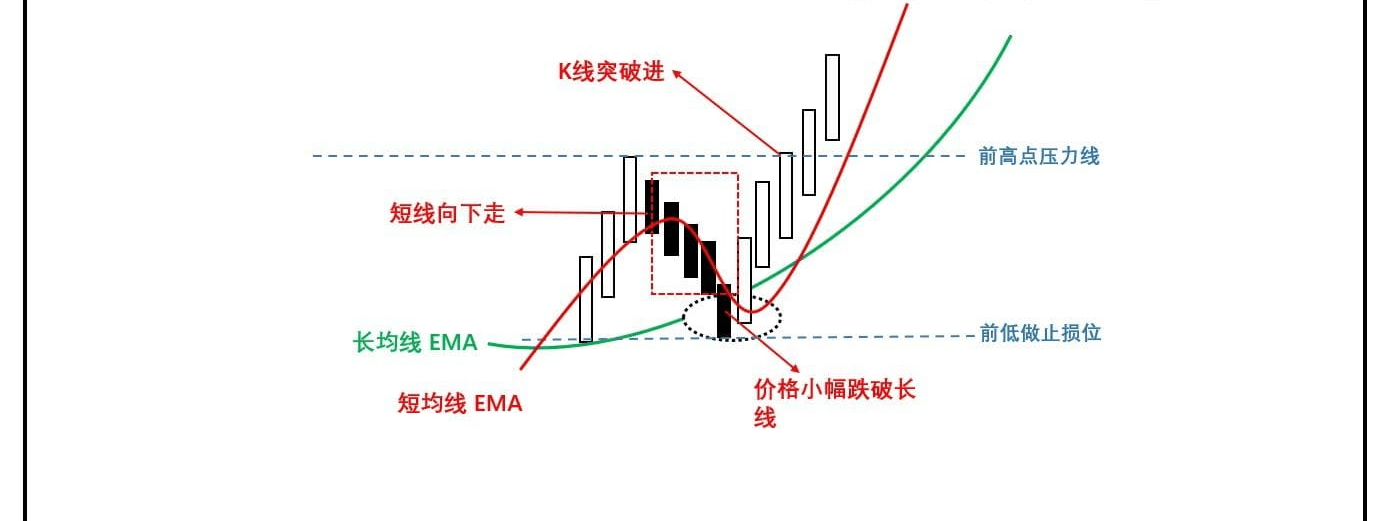
Long and short two moving averages, long line going up, short line falling or flat, pull back not breaking long, candlestick breaking in, stop loss at previous low, price breaking short line out!
 The last two real trading charts.
a. [Rebar], 15M period:
 b. [Gold XAUUSD], 4H period:
 Mnemonic and model C (taking long as an example, doing the opposite for short).
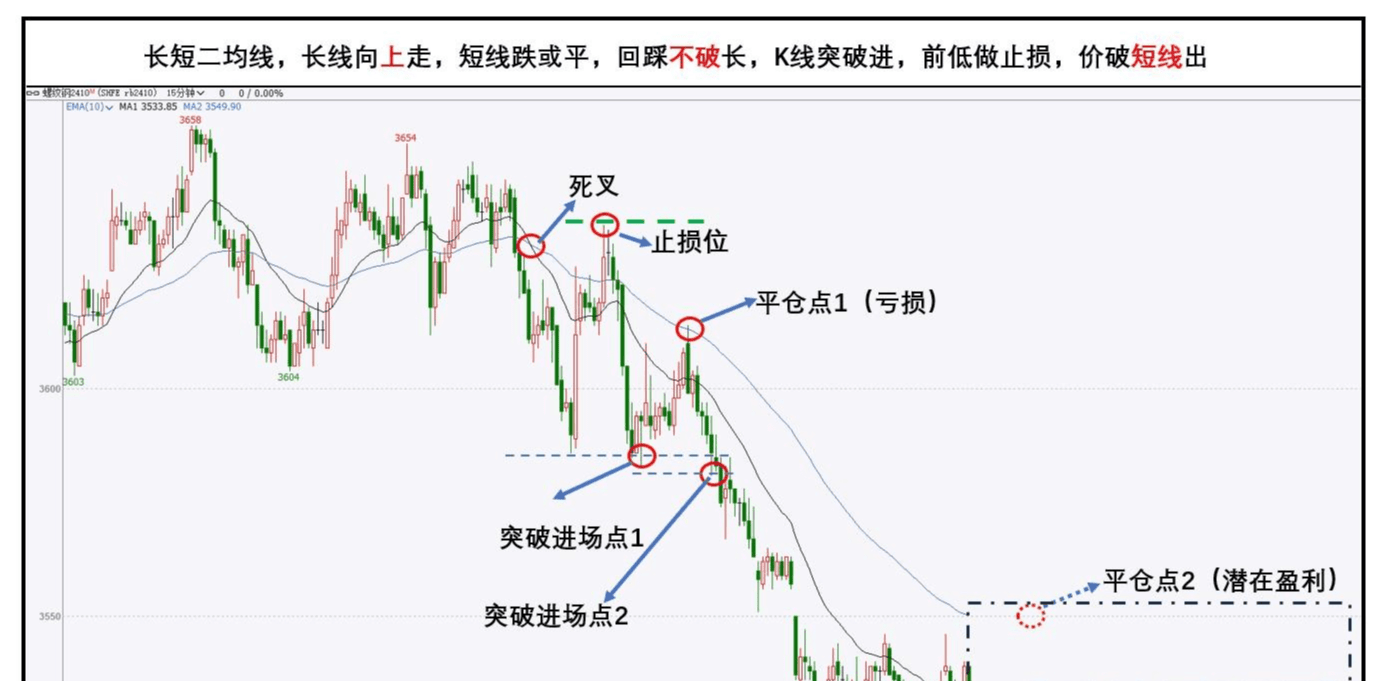
Long and short two moving averages, long line going up, short line going down, price slightly breaking long, candlestick breaking in, stop loss at previous low, price breaking long line out!
 The last real trading chart (taking short as an example).
a. [Rebar], 15M period.
Simple, right?
There are entry points, stop losses, take profits, along with simple money management: each trade's stop loss amount is controlled at 2%.
Can this simple system be used in real trading? Are you confident to go from ten to a hundred?
I think there is a very low probability that it won't happen..... because a simple system must have gone through various trials, full of details and trade-offs.
For example: C model should be used with caution; its disadvantage is that the win rate is not high (but the potential profit-loss ratio is objective...).
How to make this system self-use?
I give you the direction; practice depends on yourself.
1. Have a big picture view; the trend is everything:
Expand the period to see the trend; to determine the trend, you can use moving averages or trend lines (I'll add my experiences and insights on this later). If the big cycle looks bearish, then only look for bullish in the small cycle; conversely, if the big cycle looks bullish, then only look for bearish in the small cycle.
2. Key level is at:
Find key support and resistance levels on the market, looking at both large and small periods. The strength of key levels in the big cycle > the strength of key levels in the small cycle. Specific knowledge about key levels can refer to this answer----
 After talking about moving averages, let's talk about K.
First, remember one thing: a single candlestick or a combination of candlestick patterns cannot be used alone; they must be combined with technical tools as signals.
A. Reversal candlestick signals: 1. Dragonfly line / Gravestone line; 2. Shooting star / Hammer line; 3. Popular line / Inverted hammer line; 4. Bearish / Bullish engulfing (Dark cloud cover / Piercing pattern); 5. Evening star / Morning star.
B. Aggressive candlestick signals: 1. Three soldiers / Three ducks; 2. Rising three methods / Falling three methods; 3. Gap up full sun / full shadow; 4. Immortal pointing the way;
C. Warning candlestick signals: 1. Doji.
The moving average system mentioned above basically selects breakouts for entry. As the entry signal, you can choose B. Aggressive candlestick signals.
If you choose to enter the market on a pullback, you can wait for the candlestick to pull back near the moving average, using A. Reversal candlestick signals or doji, such as: Dragonfly line / Gravestone line.
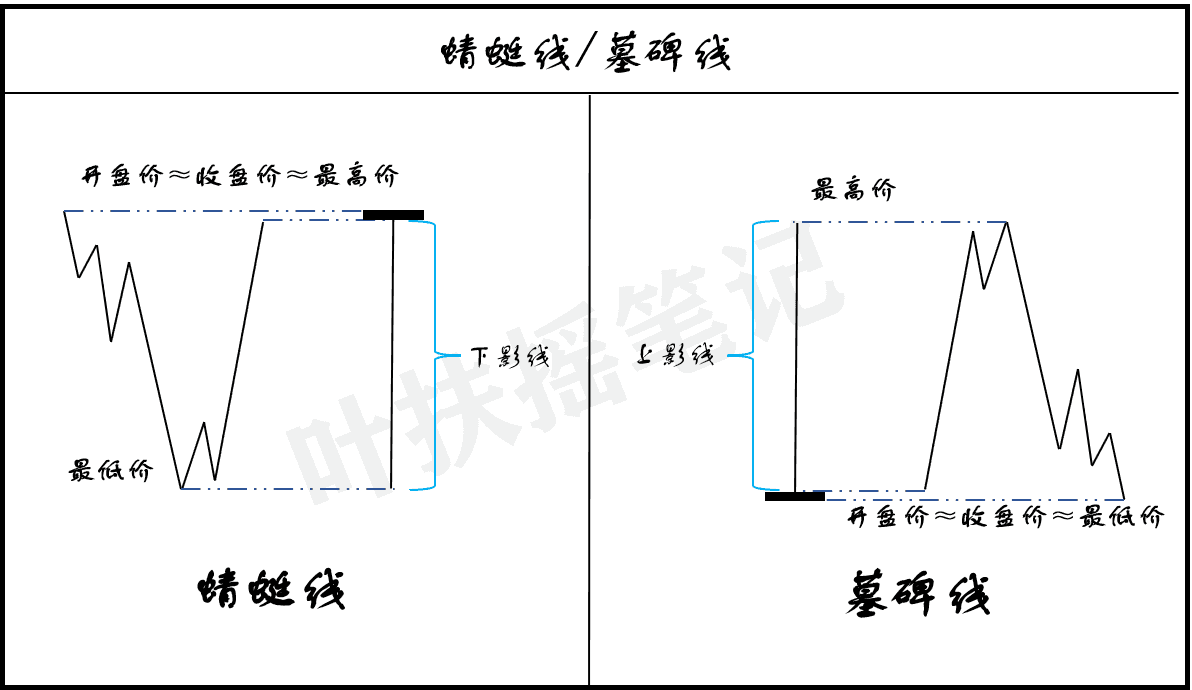 Basic candlestick patterns - Dragonfly line / Gravestone line, and trading strategies you need to learn.
or Doji
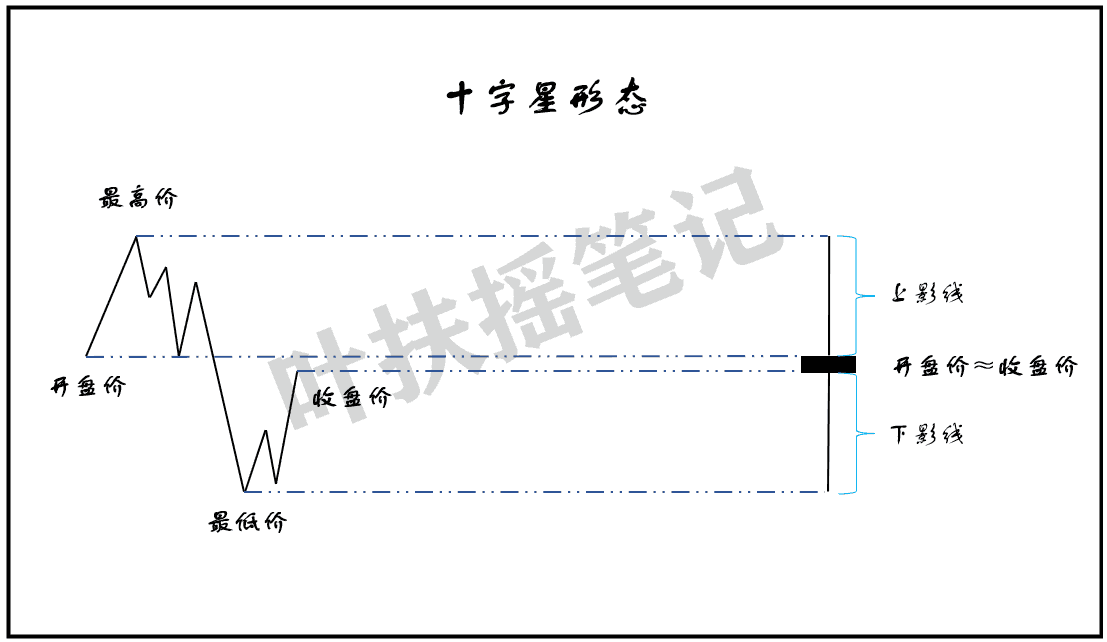 Basic candlestick patterns - Doji, and trading strategies you need to learn.
Above is the answer to how to build a simple and practical trading system using moving averages and candlesticks.
How to do it depends on yourself.
I hope this helps those who see it. I've heard that giving a like can improve win rates and increase profit-loss ratios, making it bigger and stronger!!
The system has provided you with the direction; the rest is up to you to practice on the market, simulate, use small real funds, and gradually internalize it for your own use. May you also go from ten to a hundred!
I am Little Egg Tart, a professional analyst and educator, a mentor and friend on your investment journey! As an analyst, the most basic thing is to help everyone make money. I will help you with confusion and positions, using strength to speak. When you are lost and don't know what to do, pay attention to Little Egg Tart and Little Egg Tart will guide you #美联储重启降息步伐 $BTC.
