
The Big Picture
Most traders focus on candles.
Smart money focuses on cycles.
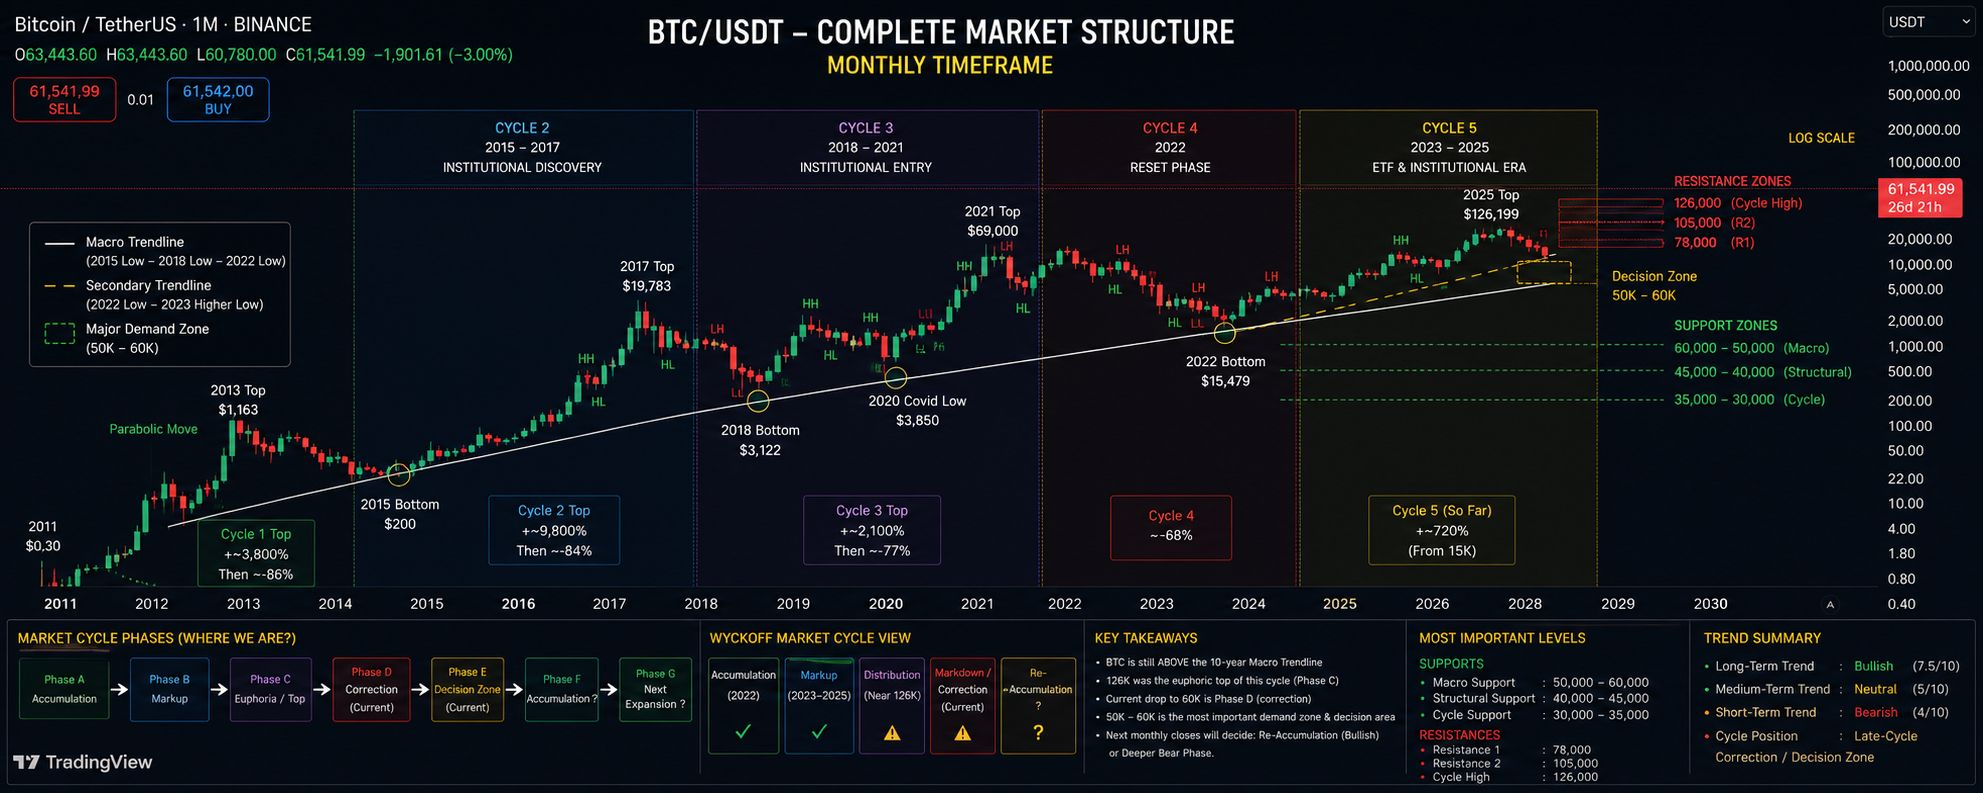
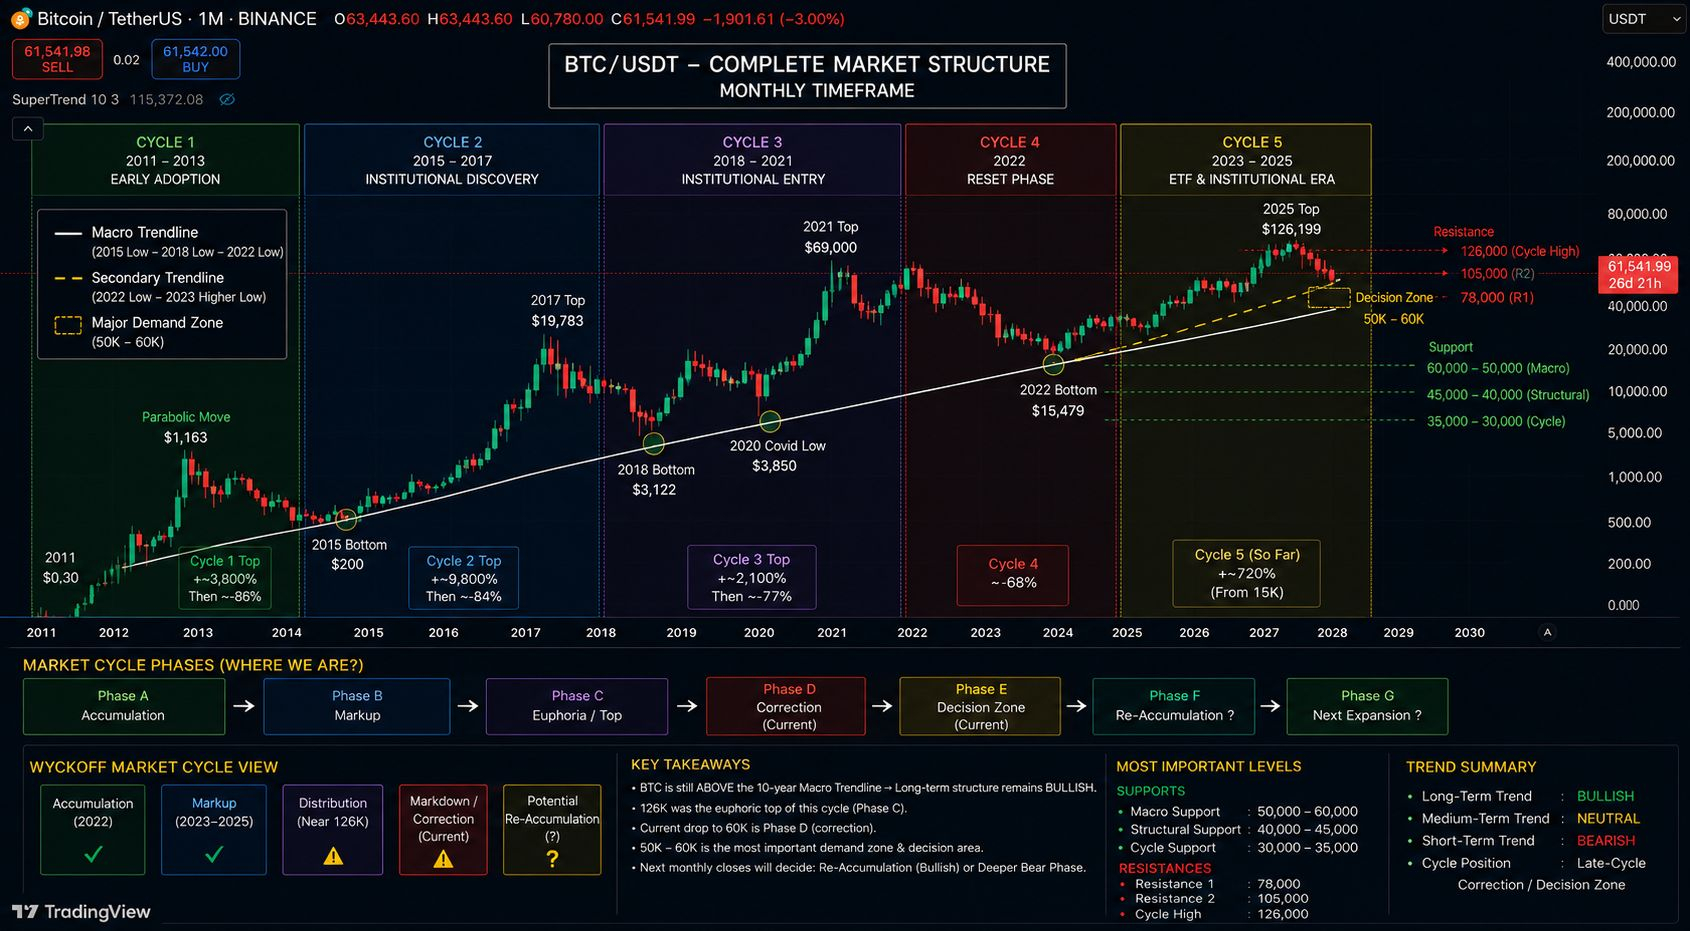
The monthly Bitcoin chart is not simply a collection of price movements. It is a visual record of liquidity expansion, capital rotation, adoption growth, and investor psychology repeating across multiple market cycles.
To understand where Bitcoin may be heading next, we must first understand where it has already been.
---
Cycle I: The Discovery Phase (2011-2013)
Every transformational asset begins in obscurity.
Bitcoin's first cycle was driven by curiosity, innovation, and a small group of early believers. As awareness increased, demand rapidly outpaced supply, producing one of the most explosive rallies in financial history.
Price appreciated from mere dollars to over $1,000 before speculative excess reached unsustainable levels.
This period established Bitcoin's first recurring pattern:
Accumulation → Expansion → Euphoria → Collapse
The subsequent decline exceeded 80%, setting a precedent that would later become characteristic of Bitcoin's cyclical nature.
---
Cycle II: Market Validation (2015-2017)
The bear market that followed did not destroy Bitcoin.
It strengthened it.
During this period, Bitcoin transitioned from an experimental technology into a recognized financial asset. More importantly, a foundational macro trendline was established.
This trendline connects:
• 2015 Bear Market Low
• 2018 Bear Market Low
• 2022 Bear Market Low
For nearly a decade, this structure has served as the backbone of Bitcoin's long-term uptrend.
The cycle culminated in the historic 2017 rally toward $20,000, followed by another major correction.
However, the higher-timeframe structure remained intact.
The market had matured.
---
Cycle III: Institutional Awakening (2018-2021)
This cycle changed everything.
Bitcoin evolved from a retail-driven speculation vehicle into an institutional asset class.
The market witnessed:
• Corporate treasury adoption
• Hedge fund participation
• Institutional capital inflows
• Global media attention
Price advanced from approximately $3,000 to $69,000, creating a new all-time high and confirming a powerful continuation of the macro bull trend.
More importantly, market structure evolved.
For the first time, Bitcoin demonstrated the ability to recover from a major bear market and establish significantly higher highs.
This transformed Bitcoin from a speculative asset into a recognized macro asset.
---
Cycle IV: The Great Reset (2022)
Every bull market eventually meets reality.
The 2022 decline was not simply a correction.
It was a liquidity event.
Rising interest rates, tightening monetary policy, industry failures, and the collapse of FTX combined to create one of the most challenging environments in Bitcoin's history.
Price declined from approximately $69,000 to $15,000.
Despite the severity of the decline, one critical fact remained unchanged:
The decade-long macro trendline never broke.
This distinction separates a structural bear market from a cyclical reset.
Bitcoin experienced the latter.
---
Cycle V: Institutional Capital Era (2023-2025)
The current cycle represents the most important transition in Bitcoin's history.
Unlike previous rallies driven primarily by retail speculation, this expansion has been heavily influenced by institutional participation and ETF-related demand.
Price advanced from approximately $15,000 to nearly $126,000.
This achievement confirmed three critical developments:
✓ Higher Highs
✓ Higher Lows
✓ Continuation of the Macro Uptrend
Most importantly, Bitcoin decisively exceeded the previous cycle peak near $69,000.
Historically, assets that successfully reclaim and surpass prior cycle highs often remain in secular uptrends rather than entering structural decline.
---
Where Are We Now?
The market currently appears to be transitioning through a classic late-cycle structure.
Phase A
Accumulation ✓
Phase B
Expansion ✓
Phase C
Euphoria ✓
Phase D
Correction ✓
Phase E
Decision Zone ⚠
This is the phase where long-term trends are either reaffirmed or challenged.
The market is no longer asking whether Bitcoin can rally.
The market is asking whether the next rally begins immediately or after a prolonged period of re-accumulation.
---
The Most Important Trendline on the Chart
The defining structural support remains the macro trendline connecting:
• 2015 Low
• 2018 Low
• 2022 Low
As long as Bitcoin remains above this trajectory, the broader thesis remains unchanged:
The secular bull market survives.
Corrections can damage momentum.
Only structural breakdowns destroy trends.
Currently, momentum has weakened.
Structure has not.
---
Understanding the Current Correction
The decline from $126,000 toward the $60,000 region has generated significant fear.
However, from a cycle perspective, corrections following exponential expansions are normal.
What matters is not the decline itself.
What matters is where the decline stops.
The market is now testing a zone that may determine the direction of the next multi-year move.
---
The Battlefield: $50,000-$60,000
This region represents the most important area on the entire chart.
Why?
Because it sits at the intersection of:
• Historical demand
• Institutional positioning
• Market psychology
• Long-term structural support
If buyers defend this area, Bitcoin could transition into a re-accumulation phase before targeting new highs.
If this region fails, the probability of a deeper cyclical correction increases significantly.
---
Wyckoff Interpretation
The current structure can be interpreted as:
Accumulation ✓
Markup ✓
Distribution ⚠
Markdown ⚠
Potential Re-Accumulation ❓
The next several monthly candles will likely determine whether the market is preparing for another expansion cycle or entering a prolonged consolidation phase.
---
Strategic Outlook
Long-Term Trend
Bullish
Medium-Term Trend
Neutral
Short-Term Trend
Bearish
Structural Assessment
Macro Uptrend Intact
Cycle Status
Late-Cycle Correction / Decision Phase
---
Final Assessment
Bitcoin has not broken its decade-long structural uptrend.
What many market participants interpret as weakness may simply be the market digesting one of the largest advances in its history.
The $126,000 peak resembles a classic euphoric expansion phase.
The decline toward $60,000 represents the first meaningful stress test of the new cycle.
The outcome of this battle will likely determine whether Bitcoin enters a fresh expansion phase toward new highs or spends the coming months building a new foundation for the next leg of the secular bull market.
For now, momentum is damaged.
Structure remains intact.
And in long-term market cycles, structure matters far more than momentum.
