Alright team, let's break down this juicy $BNB chart and see what's cooking. After a massive run, $BNB has cooled off, offering a potential high-conviction entry right at historical support.

Technical Analysis
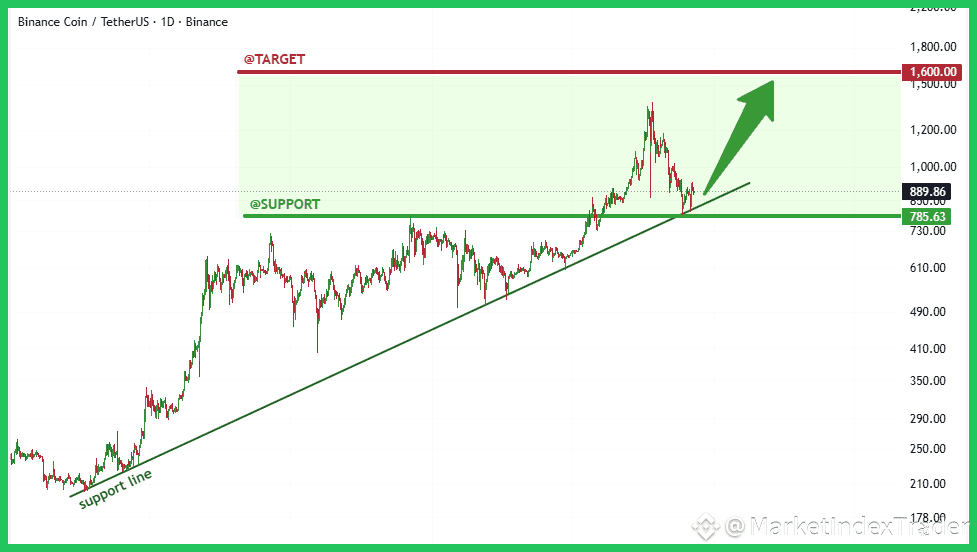
The Daily chart shows price is currently sitting right on the long-term uptrend support line, confirming the overall bull structure remains firmly intact. The most critical confluence zone is between the established horizontal support at $785 and the rising trend line. If this support zone holds, we anticipate a strong reversal. Our immediate technical target is the previous swing high, with the ultimate projected target sitting aggressively at $1,600. A sustained breakdown below $785 would necessitate a re-evaluation of the bullish trajectory.
Fundamental Tailwinds
Fundamentally, $BNB remains exceptionally robust. The continuous volume dominance of Binance and the mandatory $BNB staking required for high-yield Launchpool/Launchpad events create inherent, consistent demand pressure. Furthermore, the BNB Smart Chain (BSC) ecosystem is constantly expanding with new dApps and enhanced scalability solutions, solidifying its utility and accelerating deflationary mechanics via quarterly token burns.
Action Plan: This dip looks like a textbook healthy retest. Accumulation in this zone ($800 - $900) provides an excellent risk-to-reward ratio for the next major leg up. Highly recommend HOLD and Stacking $BNB at Binance.
Feel free to comment the altcoin you are holding and we will check it for you!
#BNB #TechnicalAnalysis #Crypto #BinanceSquare #Altcoins