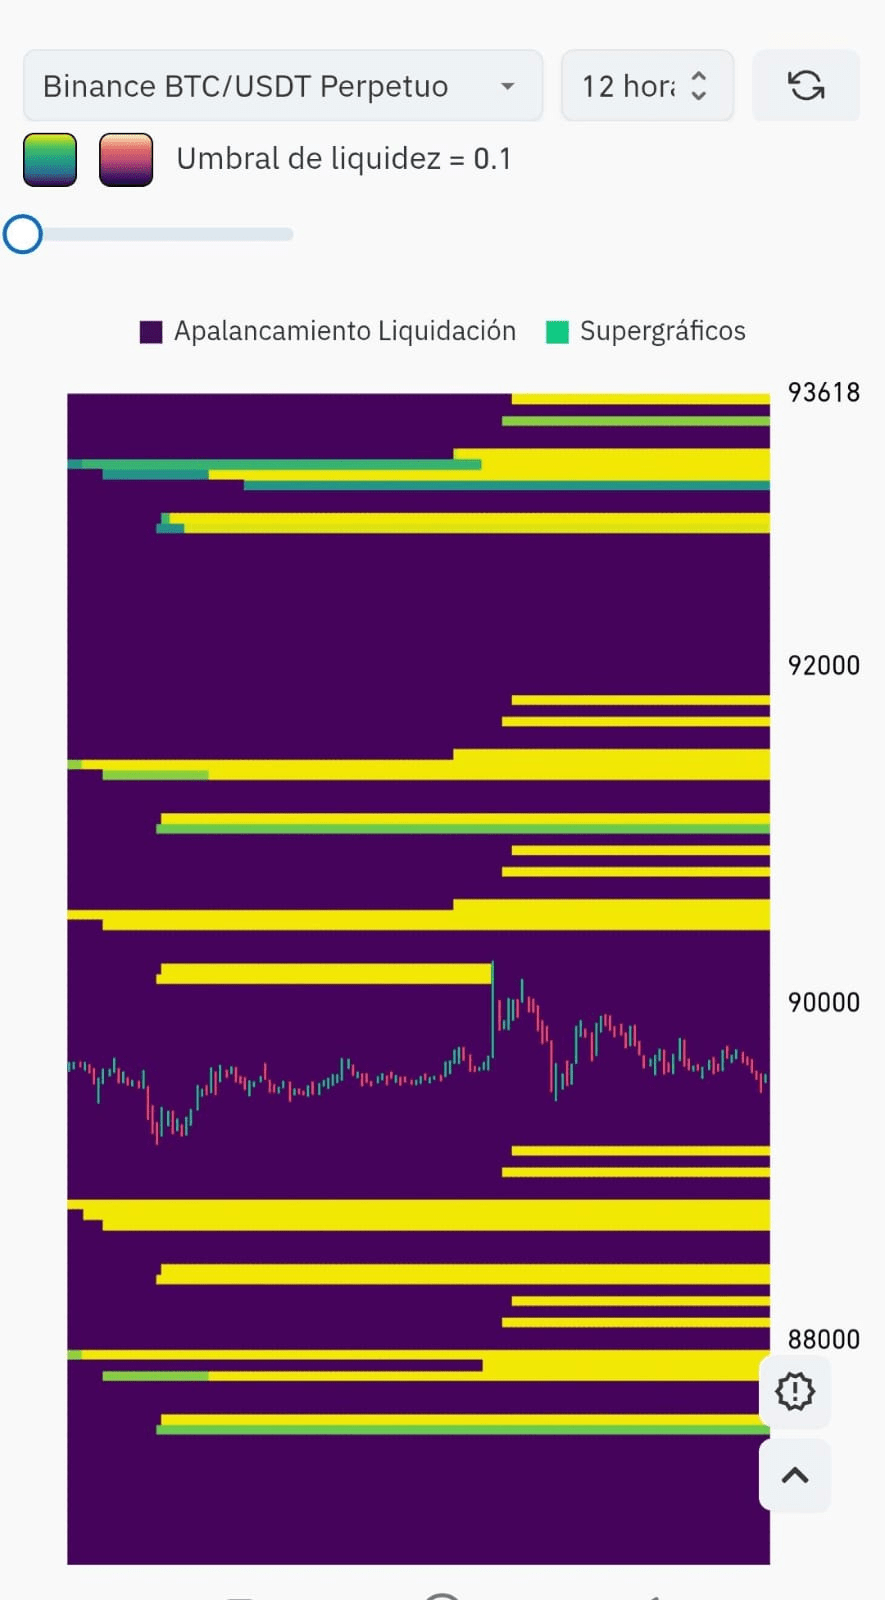
Analysis with liquidation map – Binance BTC/USDT Perpetual (12h)
The Bitcoin market is currently in one of the most critical zones of the entire month, with the price hovering around 90,000 USD while the liquidation map reveals enormous liquidity pockets both above and below.
Today it's not about whether BTC goes up or down…
👉 It's about who they are going to liquidate first.
🧲 LIQUIDITY ZONES THAT DOMINATE THE MARKET
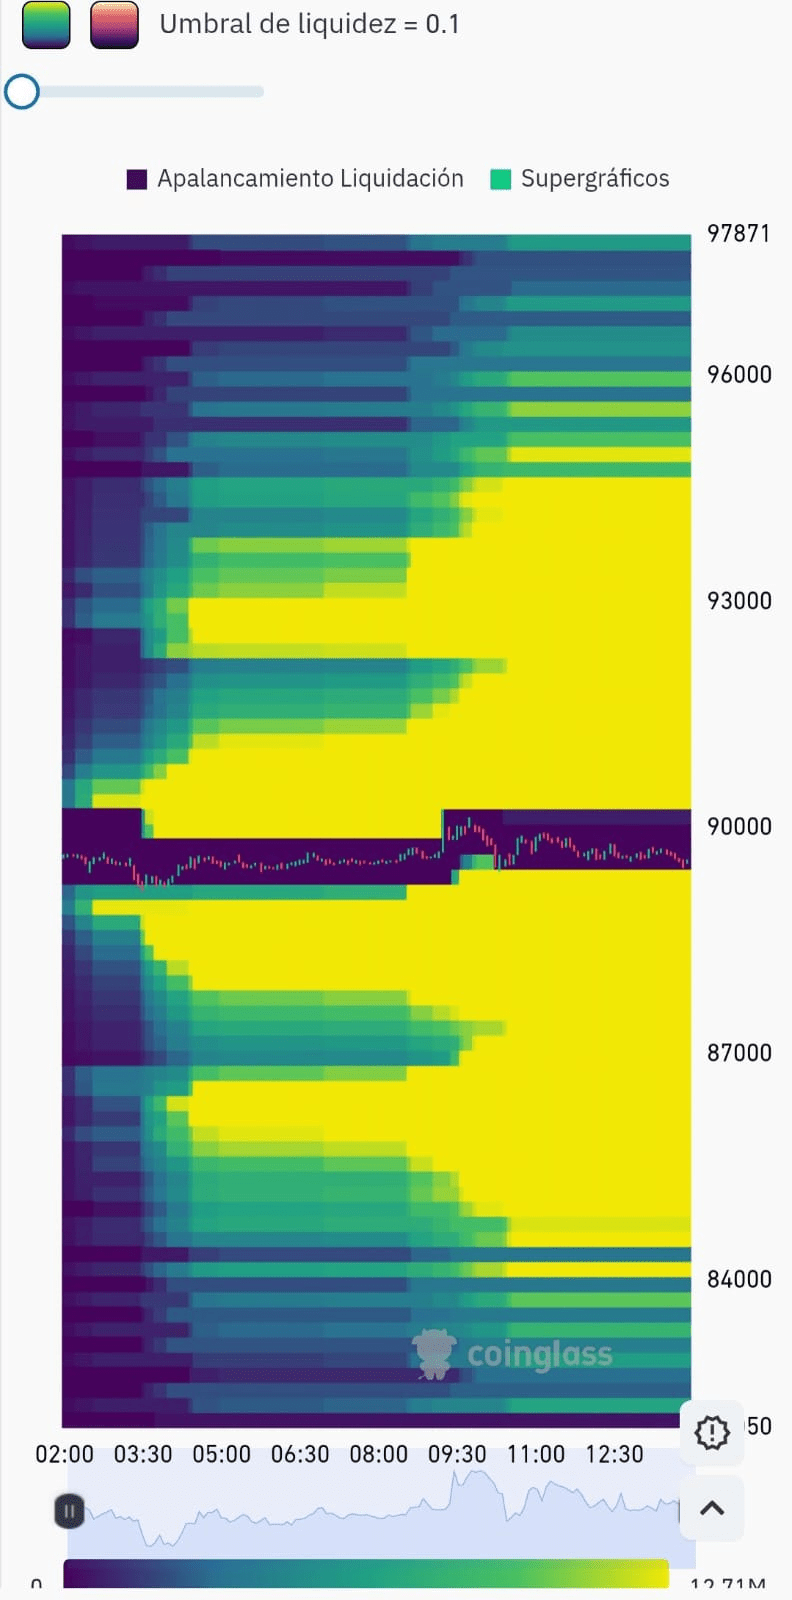
According to the current heatmap:
🔴 Upper zone (Shorts at risk)
92,000 – 93,600 USD
Large accumulation of leveraged short positions.
If BTC breaks 90,500 – 91,000, it could trigger a violent short squeeze.
🔵 Lower zone (Longs at risk)
88,000 – 87,000 USD
Greater concentration of long liquidations.
Below 88k, liquidity amplifies up to 85,000 – 84,000 USD.
👉 This confirms that the price is trapped between two liquidation magnets, and the next strong move will not be casual: it will be induced by a stop sweep.
📉 WHY HASN'T THE STRONG DROP COME YET?
Although many expect a direct drop to 86k, the map shows that:
There is still a lot of liquidity unspent in the 88k–90k area
The market is still absorbing orders
The big players continue to push the price in range to keep accumulating contracts
This usually ends in two ways:
1. False bullish breakout to burn shorts
2. Deep bearish sweep to liquidate longs
🎯 MOST LIKELY SCENARIOS IN THE SHORT TERM
🟢 Scenario A – Bullish sweep first
Break of 90,500 – 91,000
BTC seeks 92k – 93k
Then comes a strong correction
🔴 Scenario B – Direct drop
Clear loss of 88,800 – 88,000
Activation of settlements
Objectives:
86,200 – 85,400 – even 84,000 USD