Key Support 4H: 0.0961 USDT
Key Resistance 4H: 0.1548 USDT
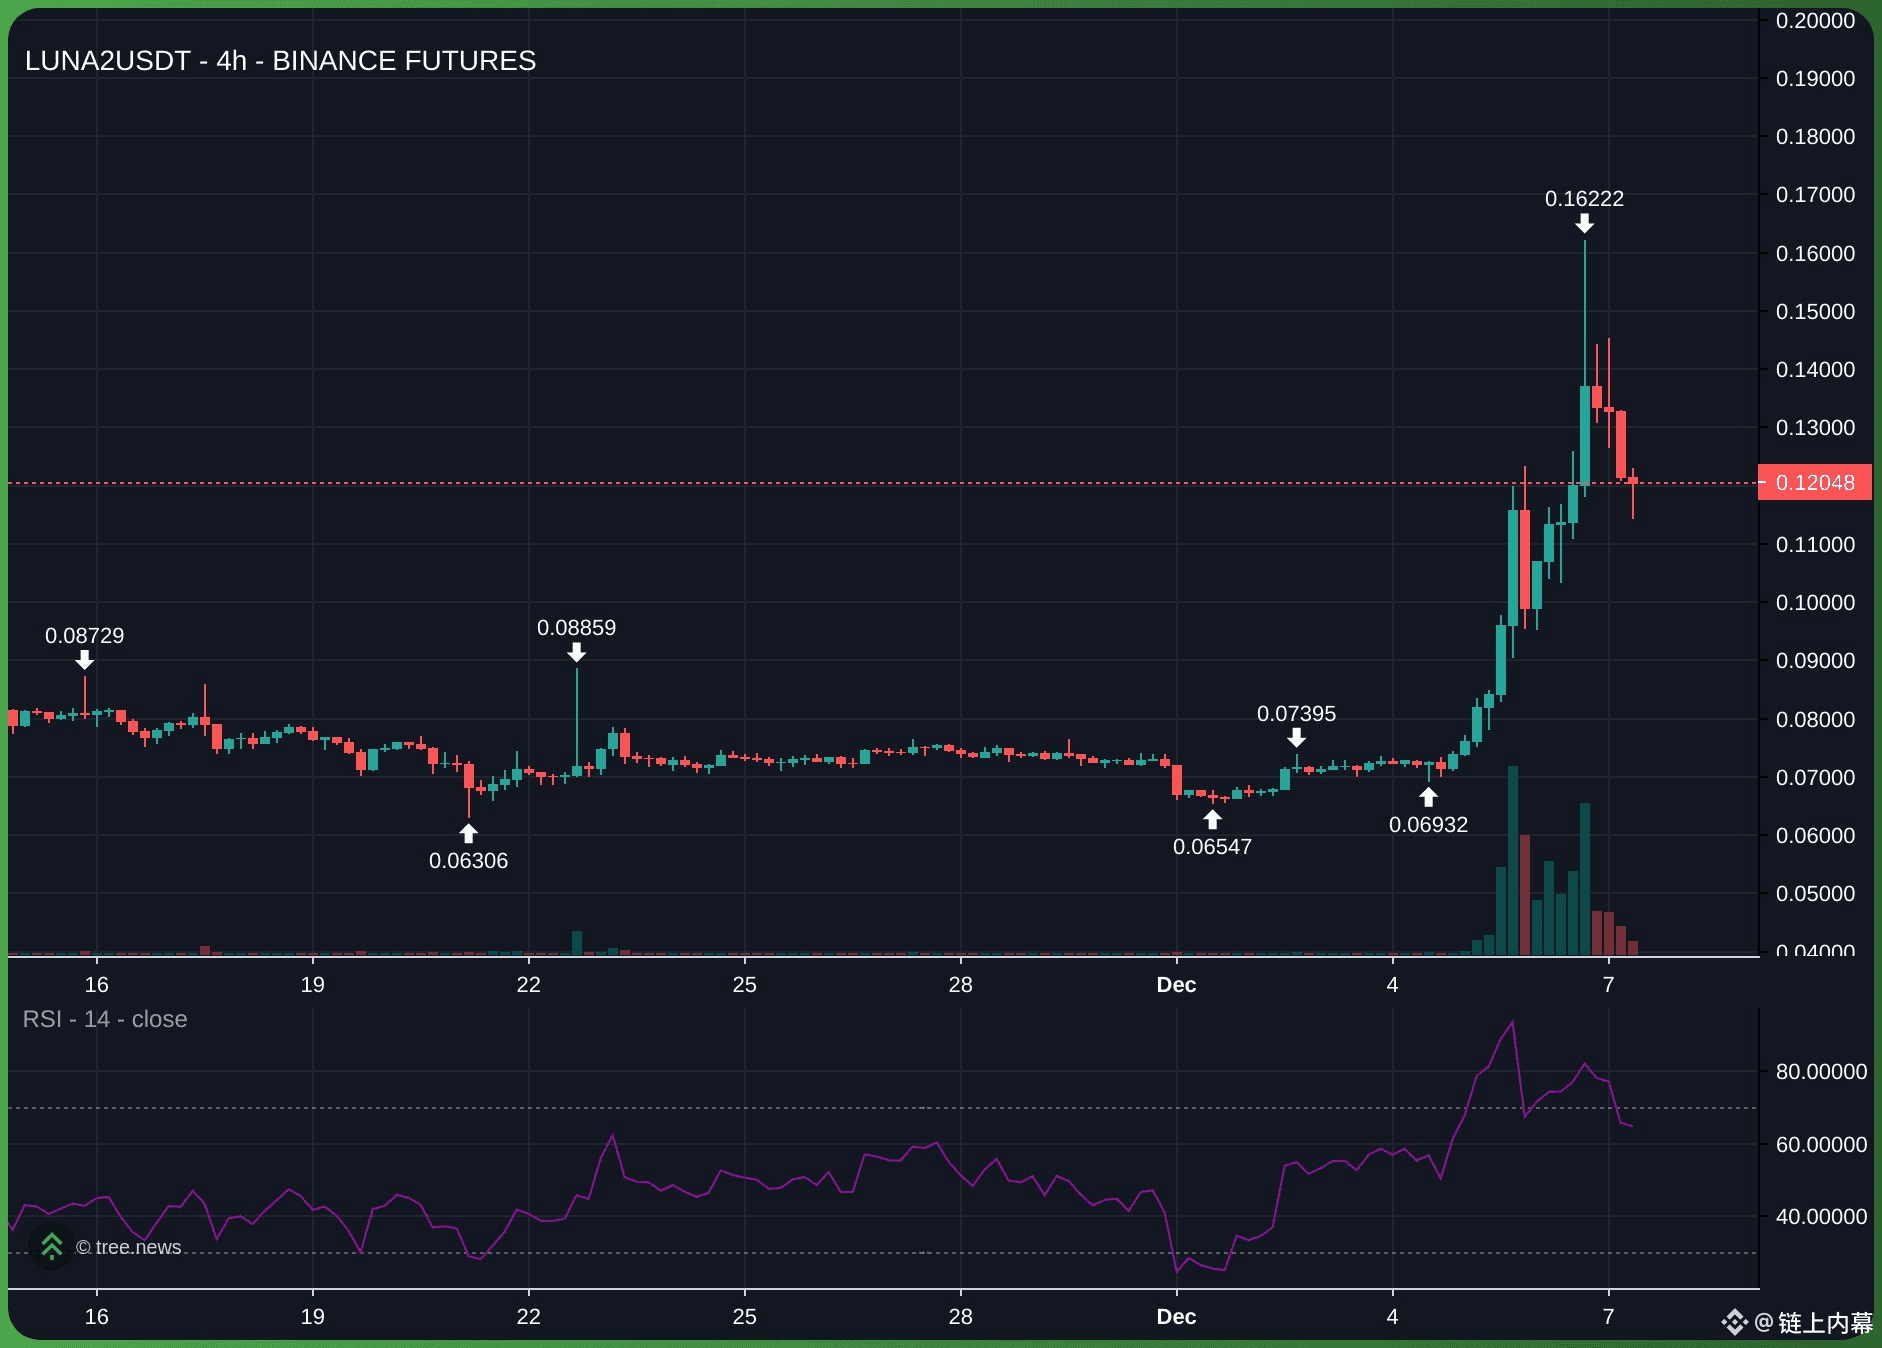
$LUNA Current Trend: Volatile with Bullish Bias
🔎 Key Observations:
Price action shows a strong rally from 0.1035 (24h low) to 0.16222 (24h high), followed by a pullback to current levels. This indicates volatility and potential healthy correction.
The presence of long wicks in recent candles (pin bars) near resistance suggests selling pressure, but higher lows indicate underlying strength.
Alignment of MACD and MA120 supports a bullish outlook, while short-term indicators (KDJ, MA5) call for caution.
📝 Technical Indicators Overview:
1. Volume Analysis: Recent 4h candles show elevated volume (1.67B at peak), supporting the bullish breakout. Volume has tapered near resistance, suggesting consolidation.
2. Capital Flow: Net contract outflows over 24H (-5.45M USDT) and 7D (-11.19M USDT) indicate profit-taking, but strong inflows in shorter timeframes (4H: +649k USDT) suggest renewed buying interest at lower levels.
⚡⚡ Analysis Result
$LUNA2 Direction: Cautious Long (with tight risk management)
📍Entry Timing: Enter on a pullback toward 0.110 - 0.115 USDT (near key support), ensuring volume confirmation. Avoid chasing the price above 0.1300 USDT.
🗑️ Stop Loss: 0.1067 if entering at 0.110 )
💰 Target Price: 0.150 USDT (resistance)
