📊 $BTC
📉 Trend Overview
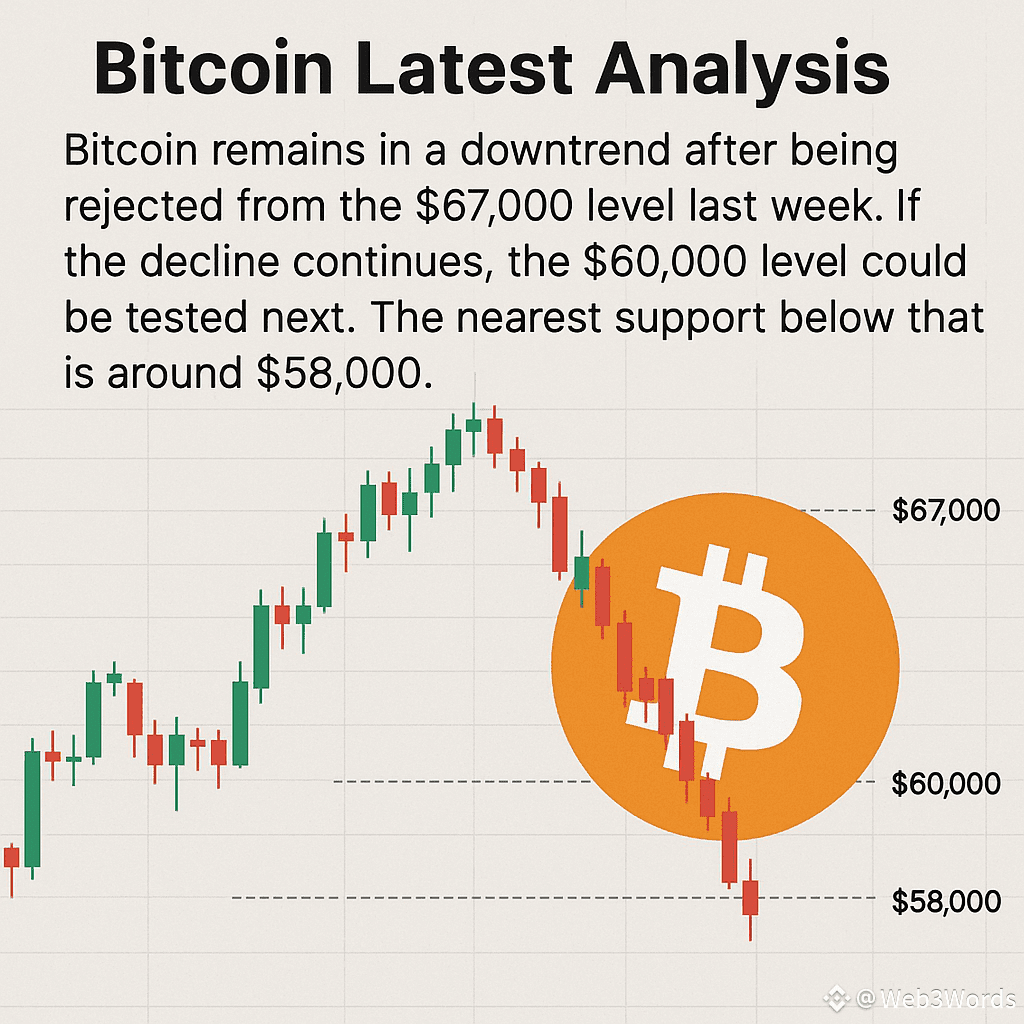
Bitcoin is currently in a pullback phase after facing strong resistance around $67,000. The recent price action shows lower highs, indicating short-term selling pressure — but the overall long-term trend remains bullish.
📈 Key Levels to Watch
Resistance Zones:
$65,000 – $67,000: Major supply zone; a breakout above this could trigger a strong rally.
$70,000: Psychological barrier and next possible target after a breakout.
Support Zones:
$60,000: Immediate strong support; buyers are defending this level.
$58,000: Critical support; if broken, a deeper correction may begin.
📊 Momentum Indicators
RSI: Neutral zone; no extreme overbought or oversold signals.
MACD: Showing slight bearish momentum, but flattening — possible reversal soon.
Volume: Increasing on upward moves, decreasing on dips — a bullish sign.
🚀 Bullish Scenario
If BTC breaks and closes above $67k, then:
Upside targets: $70k → $73k → $78k
Breakout strength may increase if volume rises.
📉 Bearish Scenario
If BTC breaks below $60k, then:
Downside levels: $58k → $55k → $52k
$58k is the most important support for bulls.
📌 Summary
Short-term: Neutral to slightly bearish
Mid-term: Preparing for potential breakout
Long-term: Bullish trend intact
Bitcoin is currently coiling up between support and resistance — a breakout move is near.

#BTCVSGOLD #BinanceBlockchainWeek #BTC86kJPShock #USJobsData #CPIWatch
