
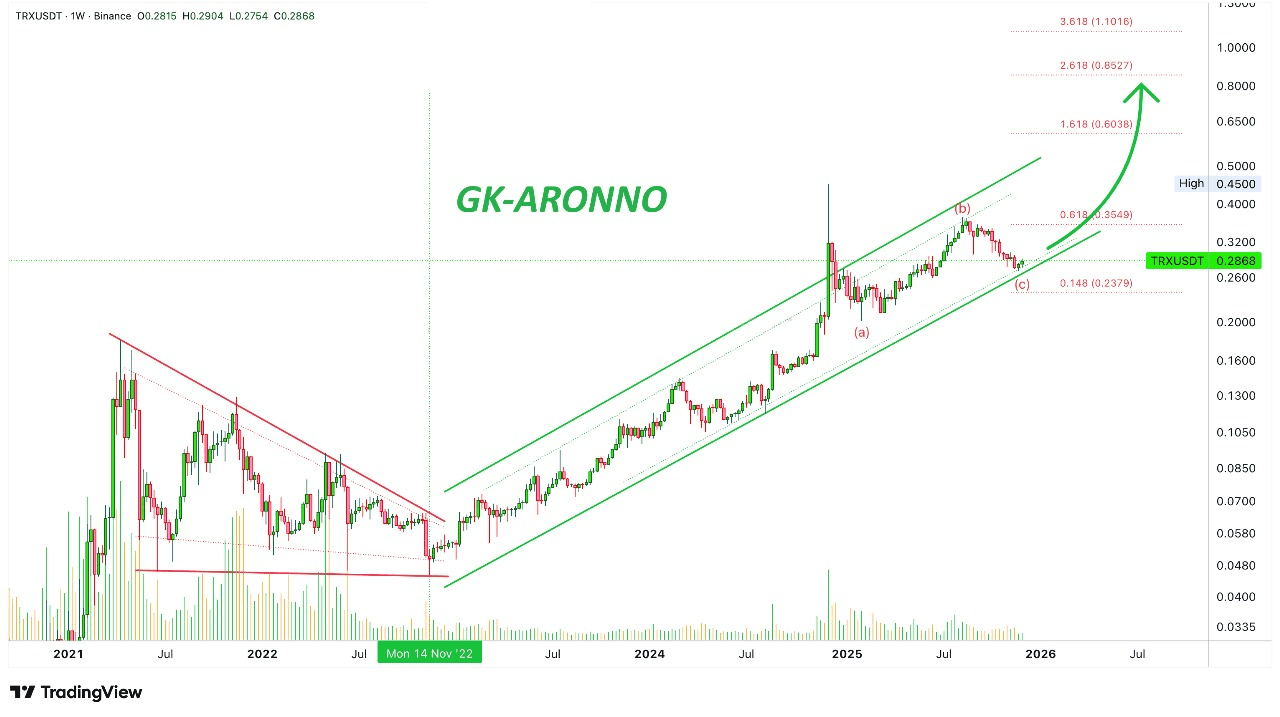
TRX reached its all-time high in December 2024. This was not a signal of the end of the bullish trend for this pair. While a lower high appeared in August 2025 based on the candle wick, the bullish trend remains intact based on the candle closes - August 2025 produced a higher high. TRXUSDT continues to rise in the long term.
TRX has been down for 105 days resulting in a -26% correction. Wave C ended last week as a higher high compared to February 2025. There is no strong downward volume on the correction. There is no pressure from sellers and no increase in volatility. There is no change in price dynamics or trading patterns. These signals tell us that the continuation of the upward trend is the most likely scenario.
Since the ATH occurred last year, we can say that TRX has not grown for 365 days. The fact is that there haven't been any new lows in a whole year revealing maximum strength. The good thing about this pair is that it cannot be manipulated by whales, bots, or exchanges because the individual owns more than half of the cryptocurrency market. So I believe no one dares to play.
The chart has a strong bullish bias and has been proven by sustainable long-term growth. After more than three months of downward movement without negative results, it tells us that sellers are absent. Someone, some group, some entity, or a group of entities is buying everything.
This could be a good buy-and-hold project. It has grown for more than 1,111 days and shows no signs of stopping. Excellent.
Namaste.
✅ Trade here on $TRX