SUI has had a pretty active week on the charts. It moved through a long, quiet consolidation phase, dipped sharply, and then snapped back with a strong bullish rally that pushed the price into the mid-$1.50s.
BitGuru summed it up well, pointing out how the breakout came right after that consolidation period and showed real strength from buyers.
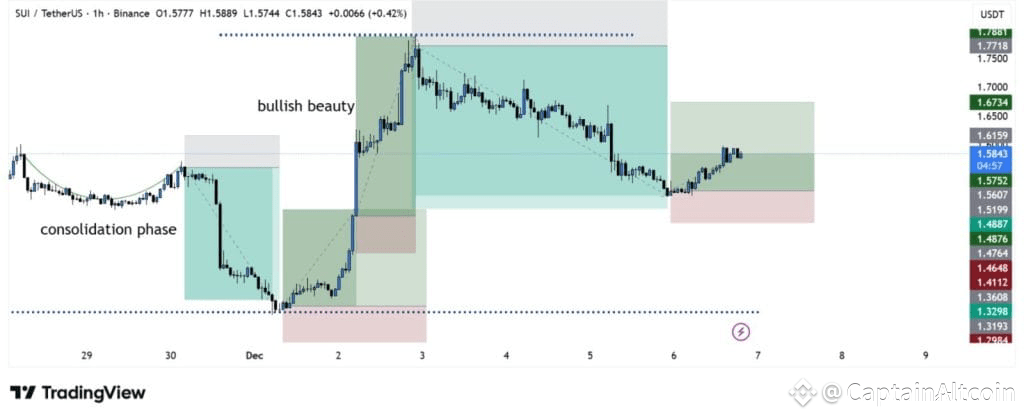
You can see it clearly on the SUI chart: a slow, tight range, a sudden breakdown, and then a clean reversal that kicked off the move upward. Now that the rally has cooled off, SUI is starting to move sideways again, but this time it’s doing it inside a brand-new demand zone.
A New SUI Demand Zone Takes Shape
The most interesting part of the current setup is how well the SUI price is holding inside this demand area.
Every time the price drifts lower, buyers show up around the $1.52–$1.56 zone and keep the chart stable. The candles are small, controlled, and not showing signs of panic, a good sign that accumulation is happening instead of distribution.
 Source: X/@bitgu_ru
It looks a lot like the structure that formed before the earlier breakout, the one BitGuru called the “bullish beauty.” The rhythm is similar: compress, break out, pull back, form demand. If the SUI price continues respecting this zone, it sets the stage for another attempt toward the upper end of the range around $1.62–$1.65.
Momentum Still Favors the Bulls
Even though the SUI price isn’t exploding upward right now, the broader trend still looks strong. The recovery rally didn’t get erased, and price continues to build structure above the key support area. As long as buyers keep defending the lower end of the demand zone, the chart leans bullish.
If momentum picks up again, the first hurdle is the top of the local range near $1.62–$1.65. Clearing that could put the previous high around $1.75 back in play.
On the flip side, losing the $1.52 support would shift short-term momentum toward sellers, but so far there’s no real sign of weakness developing.
Read Also: Sui Matches Solana but Trades at a Fraction of Its Market Cap
What’s Next for SUI?
SUI’s chart still leans positive after its strong recovery. The new demand zone is holding, buyers are active, and the structure hasn’t broken down.
As long as the SUI price stays above the mid-$1.50s, SUI looks positioned for another move higher, it’s just a matter of when the next wave of momentum hits.
Subscribe to our YouTube channel for daily crypto updates, market insights, and expert analysis.
The post How High Could SUI Price Go? Fresh Demand Zone Suggests the Bull Move Isn’t Over Yet appeared first on CaptainAltcoin.

