Many people only look at the candle... but those who pay attention to the RSI (Relative Strength Index) tend to see the movement before the explosion.
Look at what it shows us:
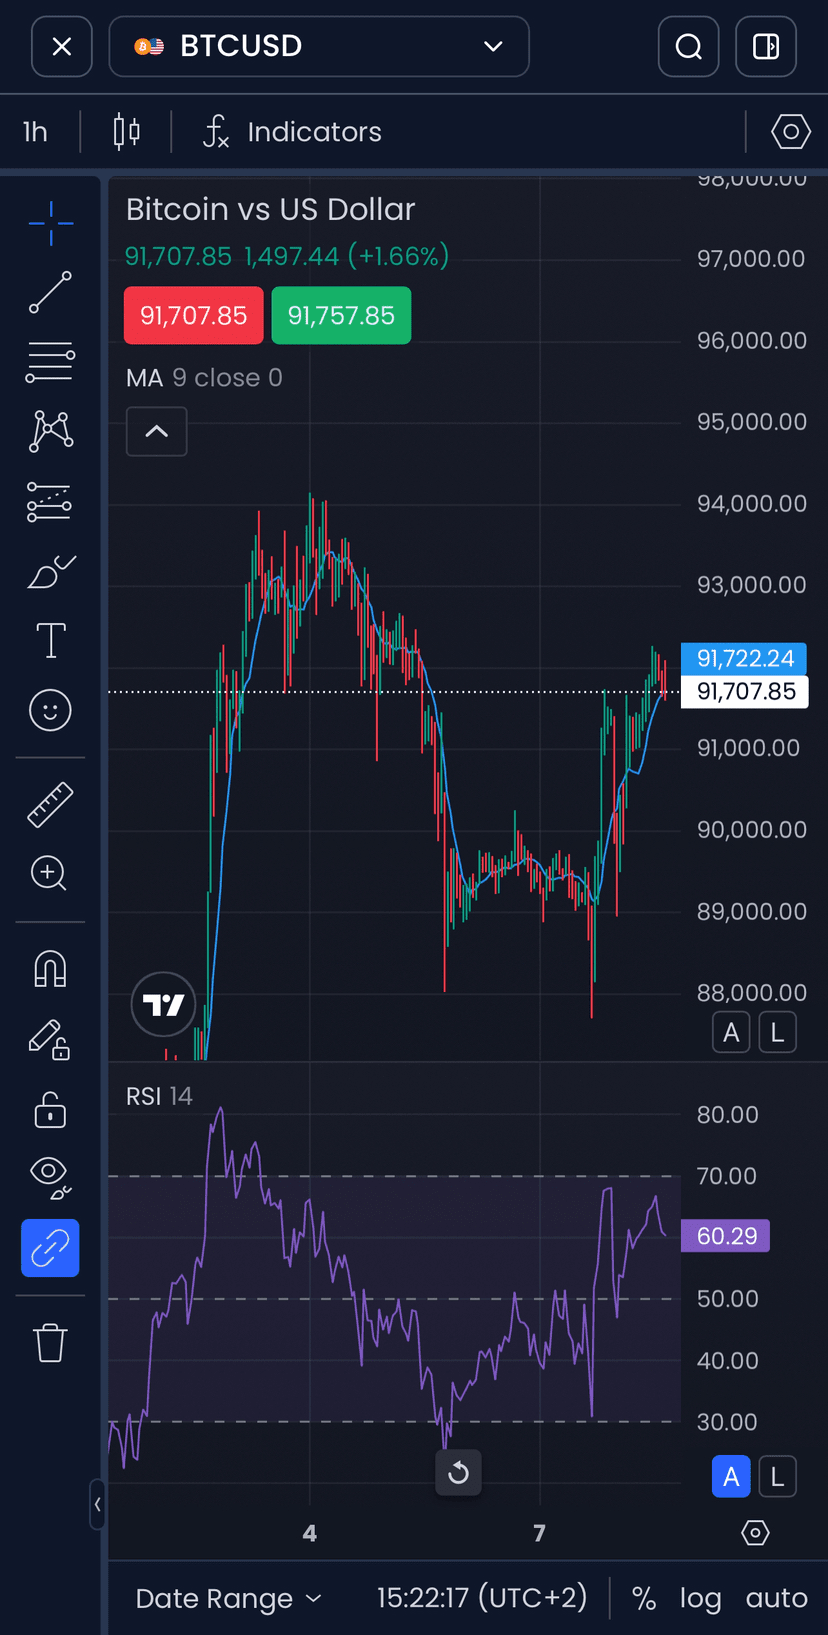
🔻 1. Extreme regions: top and bottom of the “pendulum”
• Above 70 → market stretched for buying.
When the RSI reaches this top and turns strongly downwards, it is a sign of exhaustion: buyers are getting tired and a correction or reversal may come.
• Below 30 → market stretched for selling.
If the RSI touches this bottom region and turns strongly upwards, it shows that sellers have lost strength and buyers are starting to react.
These strong “pulls” from one side to the other are the turning point of the movement. ⚡️
⚖️ 2. Middle region: zone of balance and accumulation
The area around 50 is the neutral zone:
• When the RSI is “sideways”, we have accumulation, a fight between buyers and sellers.
• If the RSI breaks the middle region upwards strongly, it usually indicates the beginning of a bullish impulse.
• If it attempts to break and is rejected, it goes back down, and often the price follows with a downward movement.
In other words: the middle of the RSI acts as a battleground. Whoever wins there usually commands the next movement. ⚔️
🧠 How do I use this reading in practice
1. I identify the context
• RSI at extremes? I keep an eye out for possible reversal/correction.
• RSI near 50? Pay attention to breakouts and rejections.
2. I wait for a clear signal
• Strong reversals of RSI at tops and bottoms.
• Breakout or rejection of the middle zone.
3. I confirm with the price
• Strong candle, breakout of support/resistance, and aligned flow.
4. I enter with risk management
• I never trust 100% in an isolated indicator. RSI is my “radar”, not my autopilot.
🔔 Summary:
• 70+ → stretched market, watchful eye on downward turns.
• 30- → stretched market, watchful eye on upward turns.
• Region of 50 → accumulation zone; strong breakout = likely direction of the next movement.
If you understood this, you are already a step ahead of most.
Now it’s time to look at the chart, observe the RSI calmly, and let it tell you the story behind the candles. 📈👁️
#BTC #RSI #PriceAction #Binance #Trading #Crypto