Sometimes, you need to change your perspective to see the whole picture.
Recently, several analysts have found that if you measure Bitcoin not by the dollar but by the purchasing power of gold, you can gain a more comprehensive understanding of the current market cycle. — Perhaps this bear market has already entered the countdown phase.
1. Change your perspective and look at 'gold version' Bitcoin
We usually get used to looking at the market in dollars, but the dollar itself is also experiencing inflation and depreciation.
If you convert the price of Bitcoin into 'how much gold can be bought,' you can see a more genuine change in purchasing power.
In the past few years, the correlation between Bitcoin and gold has not been fixed. They only 'drop in sync' during market corrections. However, once you use gold as the pricing standard, you will be surprised to find that BTC broke below the 350-day moving average as early as August, which is a technical signal of entering a bear market.
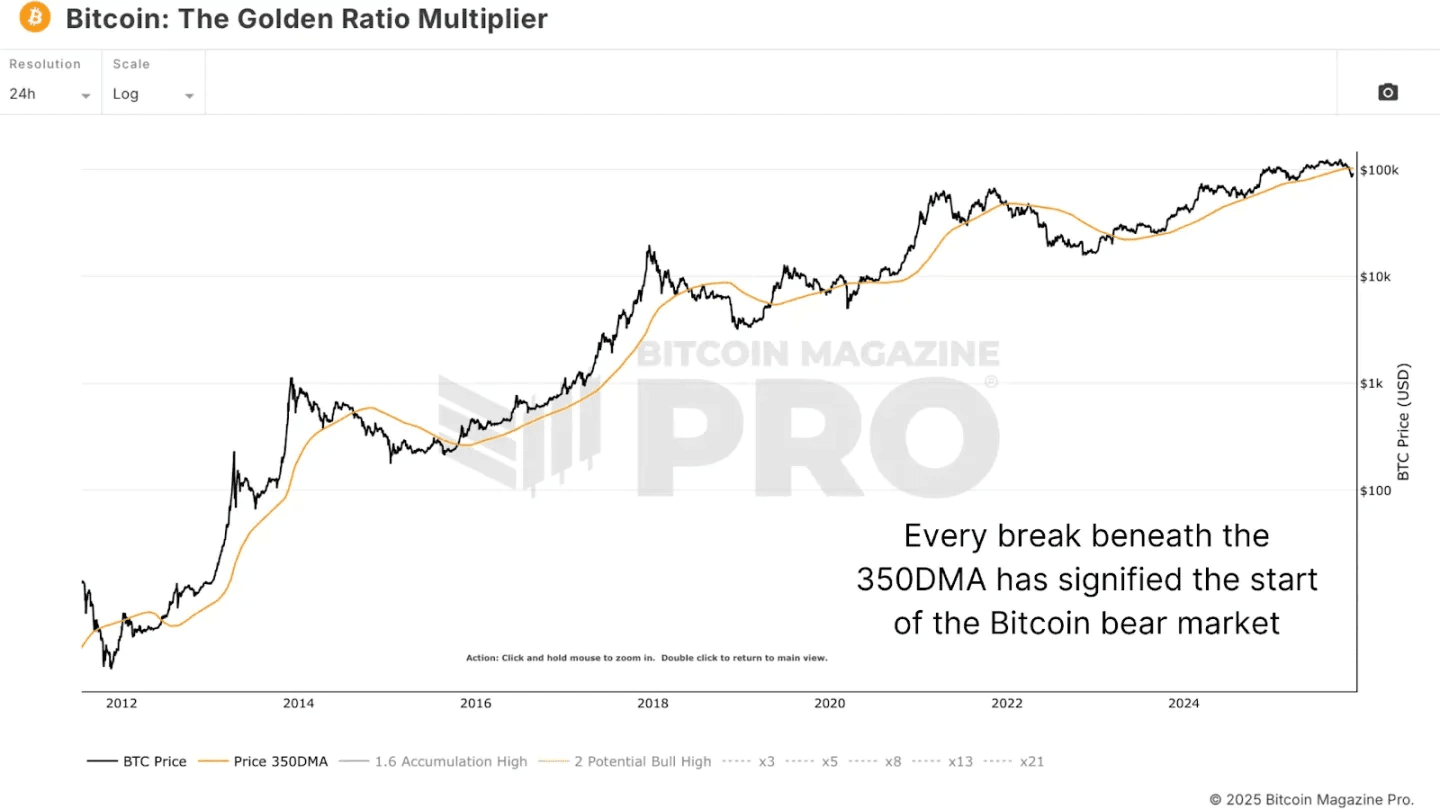
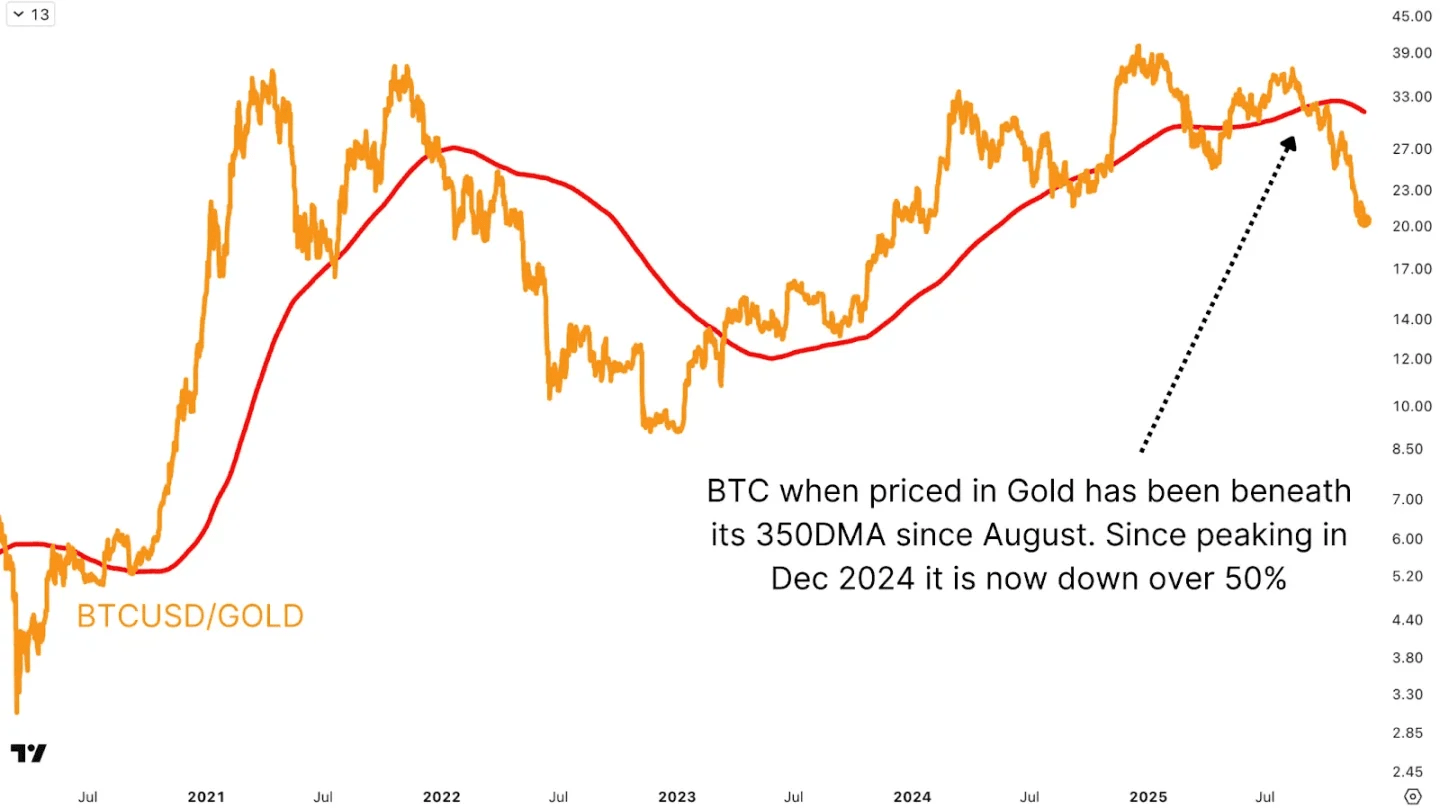
While most people are still watching the dollar's price reach new highs, the decline in Bitcoin's value relative to "gold" has actually already begun.
Second, historical patterns tell us that the bear market may be coming to an end.
Looking back at the past three major cycles:
The 2015 bear market saw a decline of 86% and lasted 406 days;
The 2017 drop was 84% and lasted 364 days;
The last drop was 76%, lasting 399 days.
This time, Bitcoin, priced in gold, has fallen by 51% and remained at that level for nearly 350 days.
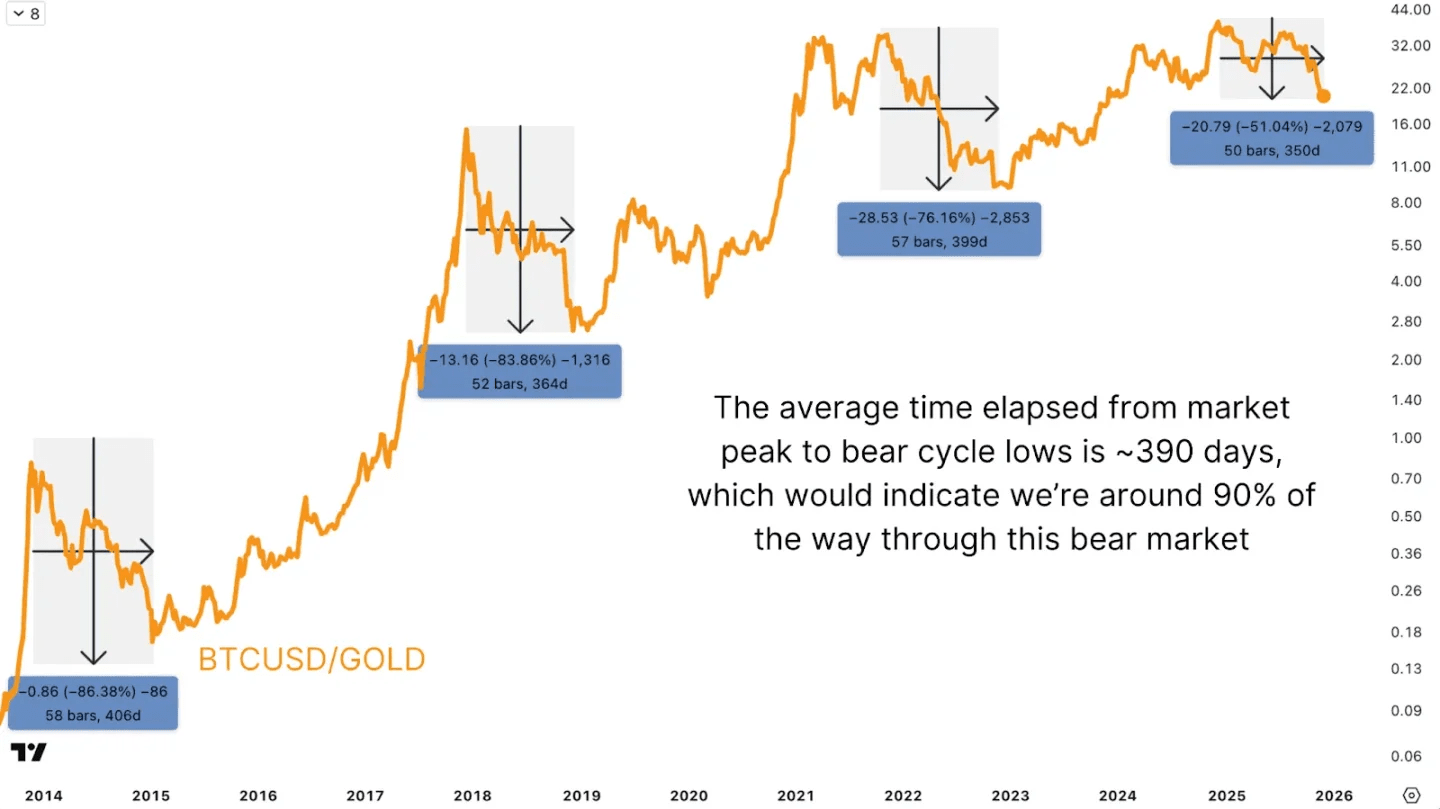
Judging from the timing and the percentage drop, this decline may have already completed about 90%. The increasingly moderate decline indicates that more long-term funds are supporting the market in each round—a clear sign of institutionalization.
Third, Fibonacci retracements tell us that we are not far from the bottom.
One of the most popular tools among technical analysts is called "Fibonacci retracement," which involves looking at the golden ratio of historical price movements.
In the first two cycles, the bottom of the bear market precisely hit the key Fibonacci support line:
The bottom of the 2015-2018 cycle fell within the 0.618 range, corresponding to approximately 2.56 ounces of gold per Bitcoin.
The bottom of the 2018-2022 cycle fell in the 0.5 range, which corresponds to approximately 9.74 ounces of gold per Bitcoin.
The latter became an important resistance level that turned into support in the subsequent bull market.
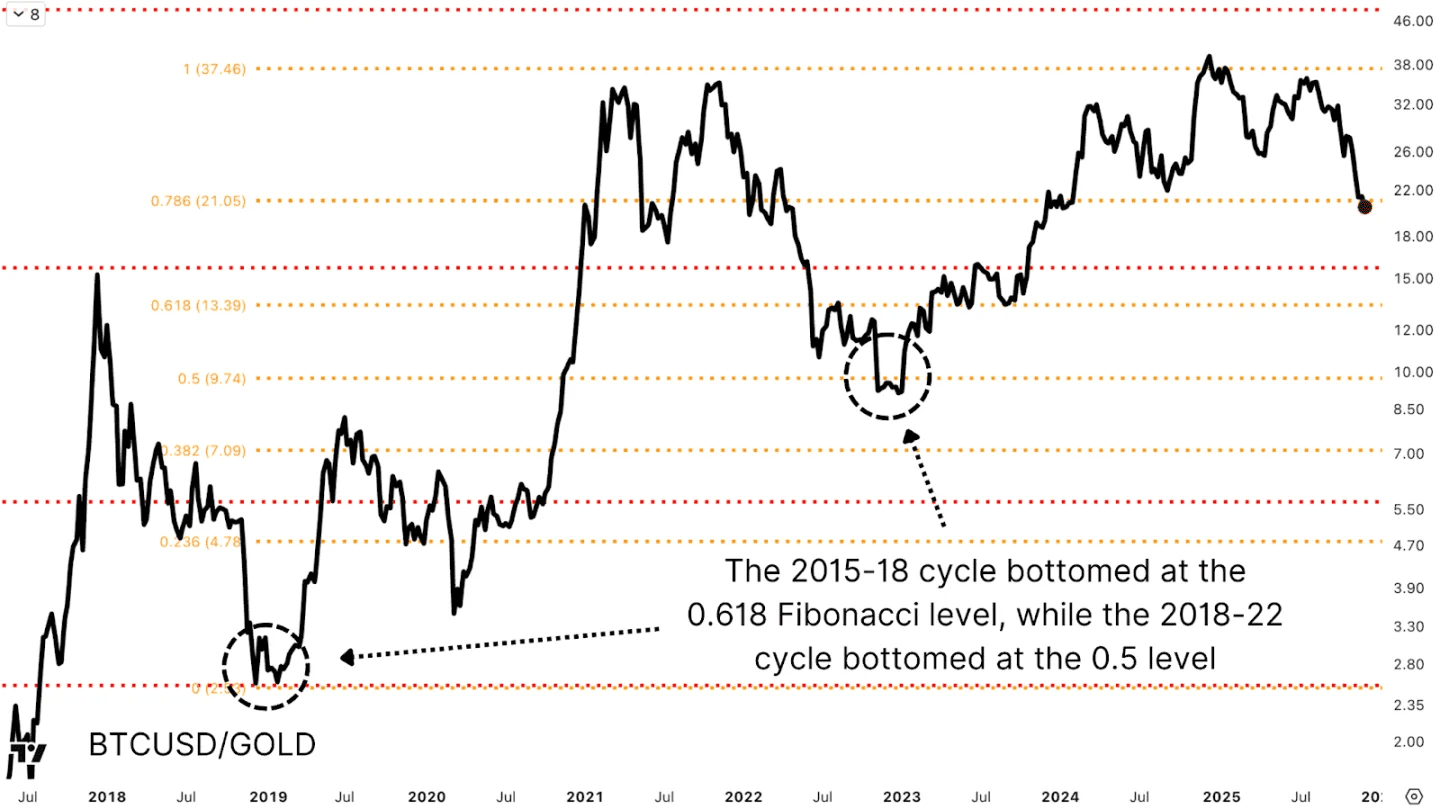
From the low of the last bear market to the high of this bull market, the 0.618 Fibonacci level corresponds to approximately 22.81 ounces of gold per Bitcoin, and the 0.5 level corresponds to 19.07 ounces. The current price is between these two levels, potentially forming an ideal accumulation zone from a purchasing power perspective.
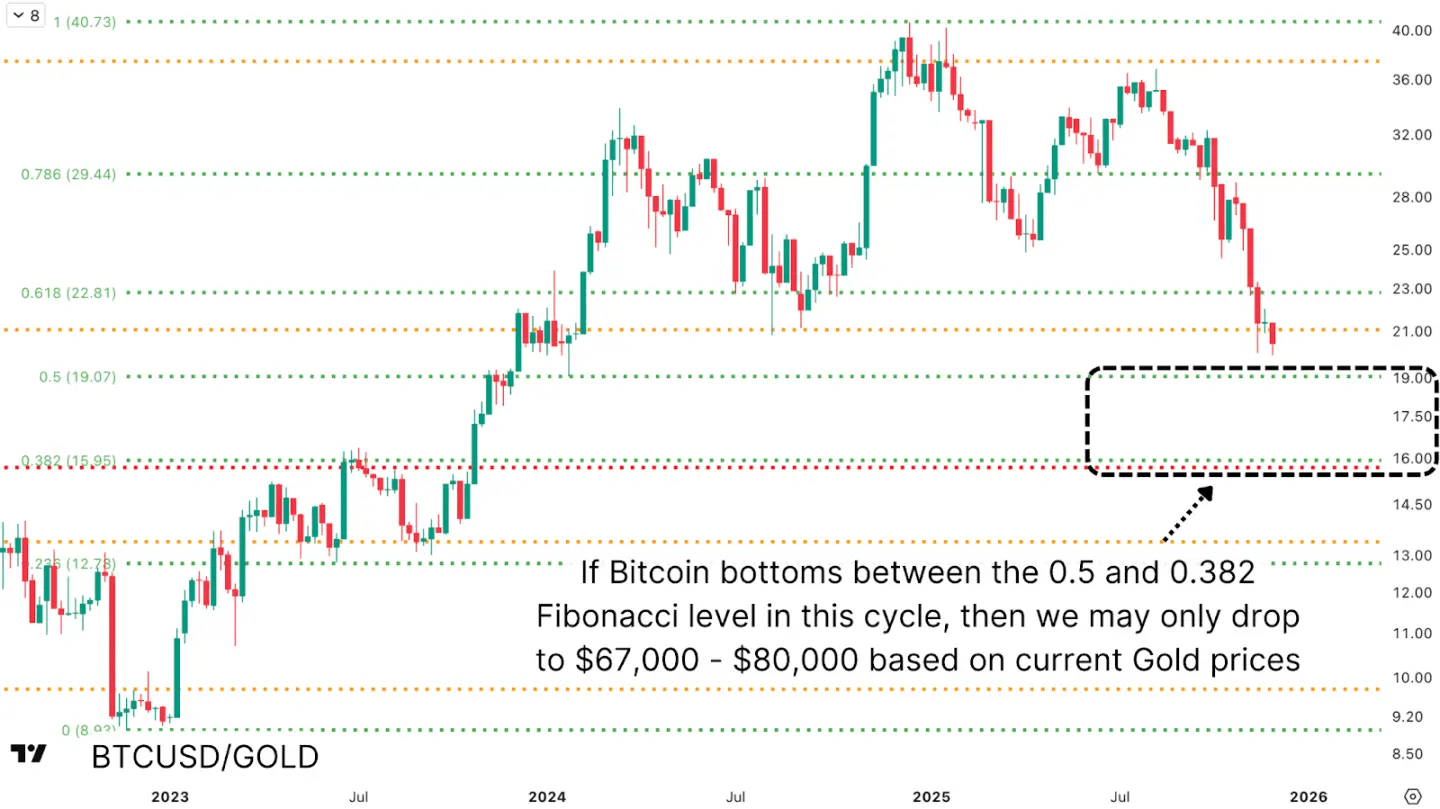
Multiple Fibonacci levels across different timeframes are converging: the current 0.786 level (approximately 21.05 ounces of gold) corresponds to about $89,160 for Bitcoin; the previous 0.618 level again points to around $80,000. If it falls further, the next key technical target is around $67,000, corresponding to the 0.382 Fibonacci level (approximately 15.95 ounces of gold per Bitcoin).
Converting these golden ratios to US dollars, they roughly correspond to a range of $67,000 to $80,000. If this logic holds true, then the current range may be the "bottoming-out consolidation zone" at the end of a bear market.
IV. What's different about this cycle?
Unlike in the past, the market now has more "smart money" involved:
ETF funds, institutional holdings, corporate asset allocation... have made the bear market decline less dramatic than in its early stages.
This means that a sharp drop may not happen again, but the bottoming pattern of the bear market will be smoother and more persistent.
No one can accurately time the market bottom, but for long-term investors, this type of range is a window of opportunity worth studying and positioning themselves in.
If you hold various altcoins or smaller cryptocurrencies and want to exchange them for mainstream assets like BTC and ETH, cross-chain tools are essential. There are many cross-chain platforms on the market, but you must pay special attention to security when choosing one—after all, cross-chain bridges have always been a major target for hackers, with historical losses due to vulnerabilities exceeding $2 billion.
We recommend prioritizing platforms with a long operating history and a solid security record. Established platforms like Bridgers, which have been operating for eight years without any security incidents, are generally more trustworthy. [For access, please follow our Twitter bio (@cherryli1314781)]

V. Conclusion: The Bitcoin bear market may be 90% complete.
Measured against assets like gold, Bitcoin's purchasing power has been declining since December 2024, and the bear market has lasted far longer than analysis based solely on dollar-denominated prices suggests. Cross-period Fibonacci retracement levels, converted to USD, indicate strong support in the $67,000-$80,000 range. While this analysis is theoretical and actual price action may not perfectly align, the convergence of data across multiple timeframes and valuation frameworks suggests that the bear market may end sooner than the market anticipates.
The pessimistic market sentiment may be sowing the seeds for a new bull market.
The turning point in the future may not arrive with a dramatic surge, but rather quietly appear at the moment you "don't care".
If you like my sharing, remember to follow me! #比特币VS代币化黄金 #加密市场观察 #比特币走势分析

