
According to the chart shared by cryptocurrency analyst Cantonese Cat, Dogecoin (DOGE) is currently above the long-term support zone defined by its monthly Ichimoku chart. The analyst noted that DOGE is "testing the lower edge of its monthly Ichimoku cloud layer."
Dogecoin Test Key Monthly Cloud Chart Support
The monthly chart for DOGE shows that the price of Dogecoin is approximately $0.14050, with a cumulative decline of about 3.8% this month. The monthly K-line opened at $0.14599, reached a high of $0.15340, and dipped to a low of $0.13177, overall showing a narrowing volatility but a weak directional trend.
Monthly Ichimoku Kinko Hyo structure analysis.
The chart uses standard parameter settings (9-26-52-26). Currently, the conversion line (Tenkan-sen) is near $0.20092, while the baseline (Kijun-sen) is near $0.27491. The forward range of the cloud (Kumo) is approximately $0.23792 and $0.26674, extending into 2026, forming a red cloud band.
The current Dogecoin price is about $0.14, significantly below the conversion line and baseline, and is currently at the lower edge of the cloud layer. The bottom of this cloud layer has gradually flattened after extending downward to the $0.12–$0.13 range, becoming a key position of interest for analysts.
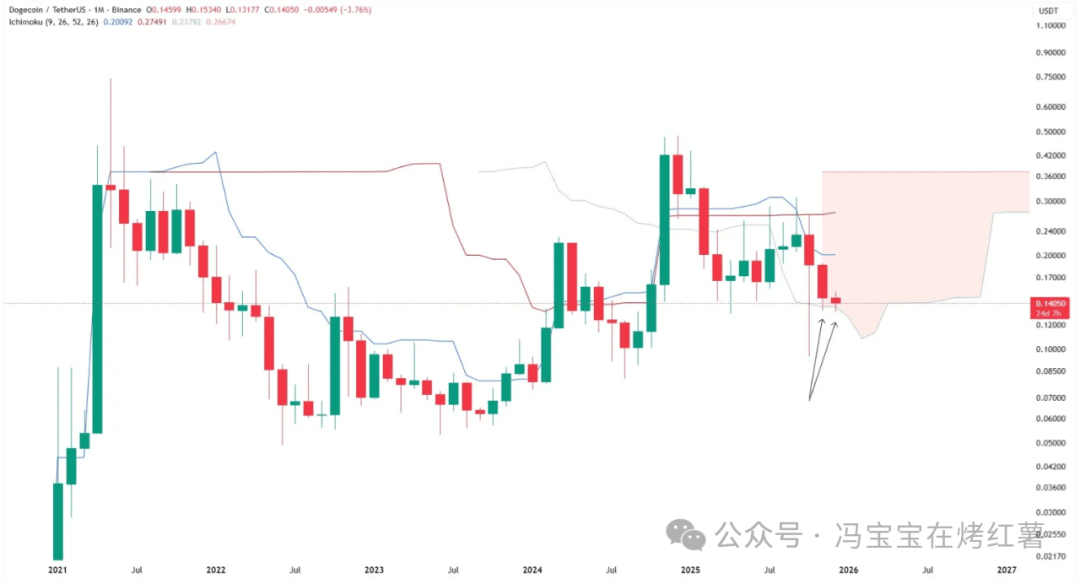
The October monthly K-line once had a long lower shadow, briefly dipping to the mid $0.06 range, but ultimately closed above the lower edge of the cloud layer. The currently forming monthly K-line is once again testing this support, and as of the screenshot, the price is slightly above this area, reported around $0.14.
For Ichimoku Kinko Hyo analysis, the lower edge of the cloud is usually considered the last support that maintains structural integrity in a higher time frame trend. In the context of the current chart, its meaning is quite clear: as long as the monthly close can remain above the $0.12–$0.14 support range, the current price structure over the past several years can be interpreted as a long-term bottom area, rather than a complete trend breakdown.
The weekly chart shows that the price is within a key support area.
On the DOGE/USDT weekly chart, the price is currently in the red support area near $0.135–$0.145. This area overlaps with historical consolidation zones and is also the horizontal resistance level prior to the previous upward breakout.
The recent weekly K-line closing prices have clustered here, with multiple upper and lower shadows penetrating this area, reflecting the market's repeated testing and contention. The current K-line is trading near $0.14392, placing the price in the upper half of this support area, but still below the 20-week, 50-week, 100-week, and 200-week moving averages, with the 200-week moving average around $0.15563.
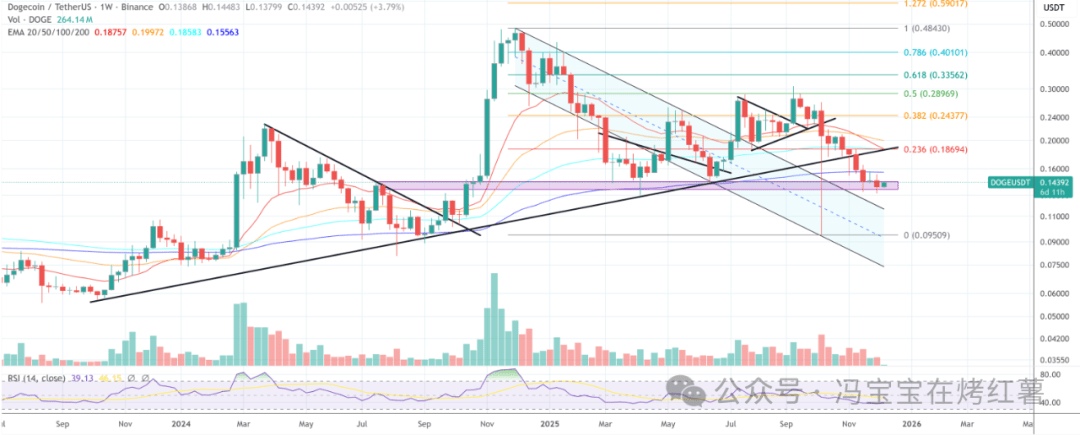
Meanwhile, Dogecoin has broken below the rising trend line support that connects previous highs, followed by a significant pullback. Currently, the broken trend line and several moving averages above form a resistance area, compressing the price between the resistance zone and the red horizontal support area, showing a consolidation pattern.
