The current INJ/USDT chart on the 1-hour timeframe shows a developing bullish structure supported by rising momentum indicators and improving volume. Although the price is still trading within a short-term consolidation range, several signals point toward a potential upside continuation if key resistance levels are broken.
Below is a detailed breakdown of price action, moving averages, volume data, and potential scenarios for traders.
---
1. Current Price Summary
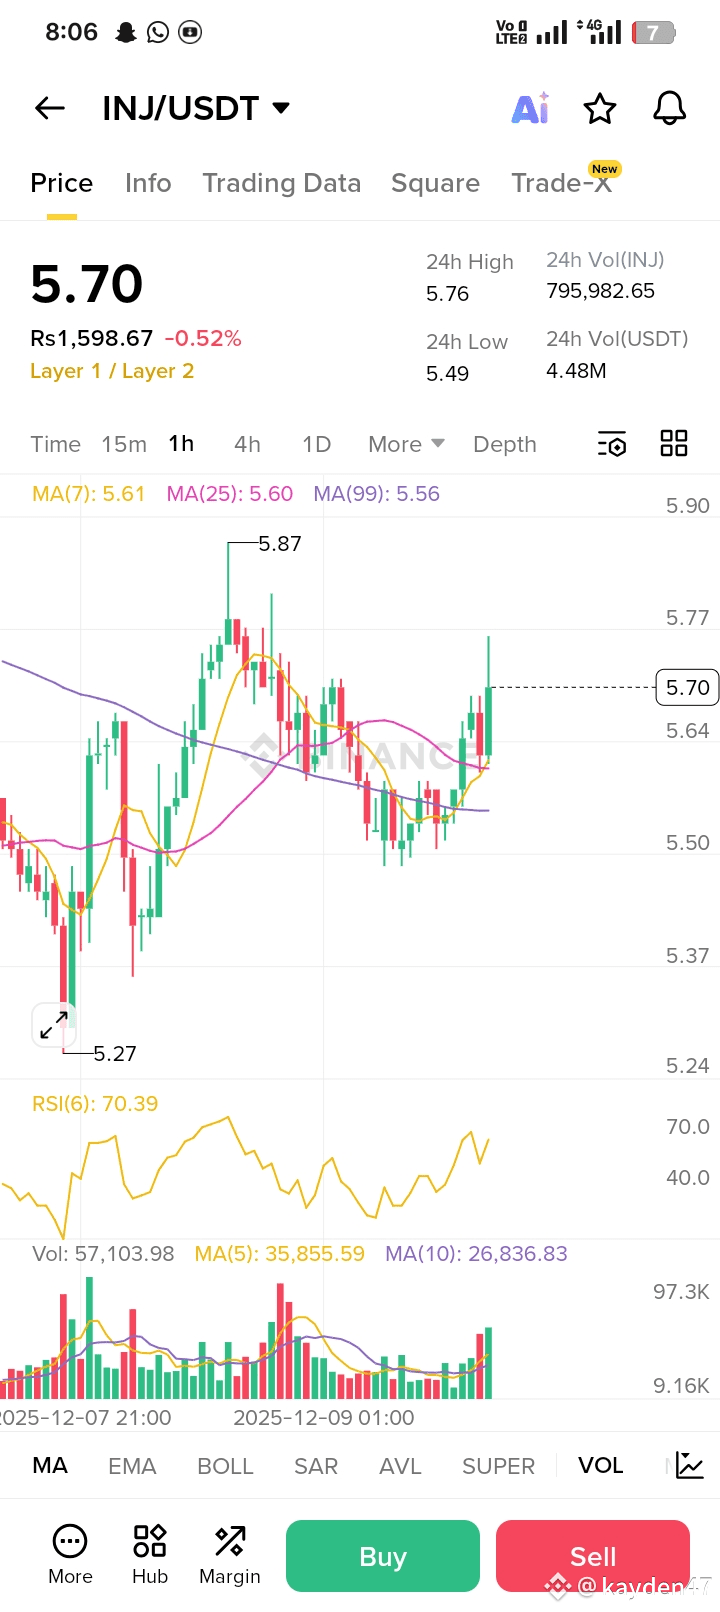
Current Price: 5.70
24h High: 5.76
24h Low: 5.49
24h Volume: ~796K INJ
Trend: Short-term bullish momentum building
Market Sentiment: Slightly positive with increasing buying pressure
The chart reflects a bounce from the recent low around 5.50–5.55 and a recovery toward the 5.70 zone.
---
2. Moving Averages (MA7, MA25, MA99)
MA(7): 5.61 – Short-term trend
The price has moved above the 7-period moving average, showing the beginning of a new upward momentum. When the price stays above MA7, short-term traders usually treat it as a buy signal.
MA(25): 5.60 – Medium-term trend
The price is slightly above MA25, which indicates stabilization and a possible trend reversal from bearish to bullish.
MA(99): 5.56 – Long-term trend
The price moving above the 99-period MA is one of the strongest signals in this chart. It shows the long-term trend is strengthening.
Interpretation of MAs Together
When MA7 crosses above MA25, a bullish short-term trend begins.
When price trades above MA99, long-term buyers return.
The convergence of all three MAs below current price suggests a potential bullish rally if resistance at 5.87 breaks.
---
3. RSI Analysis (RSI 6: 70.39)
Current RSI value: 70.39
This shows strong momentum, but also indicates the asset is entering the overbought region.
RSI Interpretation
RSI above 70 → Overbought but strong momentum
RSI between 60–70 → Bullish strength zone
RSI above 80 → High risk of correction
At 70, INJ is showing strength but traders should watch closely for a pullback.
---
4. Support & Resistance Levels
Major Resistance Levels
1. 5.76 – 24h high
2. 5.87 – Previous peak shown on chart
3. 5.90 – Psychological level
If INJ breaks above 5.87, the chart suggests a possible rally toward:
6.10
6.25
6.45
Key Support Levels
1. 5.60 – MA25 support
2. 5.56 – MA99 support
3. 5.49 – 24h low
4. 5.27 – Major chart bottom
If INJ falls below 5.60, momentum can weaken. A break below 5.49 may lead to deeper correction.
---
5. Price Action Analysis
The candlesticks show:
A strong bullish candle closing near 5.70.
Higher lows forming a short-term ascending trend.
Sellers losing strength at lower levels.
Buyers entering aggressively near 5.60.
This suggests a bullish breakout attempt, where the market has built a base and is preparing to move upward.
---
6. Volume Analysis
Recently, green (buying) volume bars are increasing.
Red (selling) volume bars are decreasing.
This indicates accumulation – smart money buying at lower prices.
Growing volume + rising price = healthy bullish trend.
---
7. Trend Summary
Short-Term Trend: Bullish
Price above MA7, RSI rising, strong green candles.
Medium-Term Trend: Bullish to Neutral
Price slightly above MA25, indicating stabilization.
Long-Term Trend: Turning Bullish
Price above MA99, confirming long-term buyers are returning.
---
8. Bullish Scenario (If price breaks 5.87)
If INJ breaks above 5.87, a strong uptrend may begin.
Upside Targets
6.00 – Psychological barrier
6.10 – First major target
6.25 – Technical resistance
6.45 – Extended target
Indicators Supporting Bullish Move
MA breakout pattern
Strong RSI momentum
Volume increasing
Higher lows forming
---
9. Bearish Scenario (If price fails 5.70 and breaks below 5.56)
If the price fails to hold 5.60–5.56, bearish pressure can return.
Downside Targets
5.49 – First support
5.35 – Mid-zone support
5.27 – Strong demand zone
Bearish Alerts
RSI above 70 may cause correction
Lower volume during breakout attempt
Rejection from 5.87 resistance
---
10. What Traders Should Watch Next
1. Breakout above 5.87
This level is the key to a strong rally.
2. RSI behavior
If RSI stays around 60–70, trend remains strong.
3. Volume
Breakout must be supported by high volume.
4. Moving averages
MA7 > MA25 > MA99 alignment would confirm strong bullish momentum.
---
11. Technical Conclusion
Based on your chart:
INJ/USDT is showing early signs of a bu
llish reversal.
Buyers are gaining control.
Price is above major moving averages.
RSI indicates strong momentum.
Volume supports upside movement.
However:
Resistance at 5.87 is critical.
RSI overbought zone may cause a temporary pullback.