Let's see, folks, here's the deal: while Bitcoin and Ethereum have been somewhat down, Litecoin (LTC) has remained sturdier than an oak, rising 7.8% last week. But what has everyone watching is an analysis by a chart genius named MadWhale on TradingView. Keep an eye on this! 👀
According to this expert, LTC has all the technical structure to break a "descending channel" that has been controlling its price for weeks. Think of that channel as a cage; if the price manages to break out from the top, the beast is unleashed! 🐂 Right now, with the price hovering around $83, if it breaks the resistance and shoots up to $110, we're talking about a jump of 33%! 🤑
The trick, says MadWhale, is that the support zones (where people buy and the price stops falling) have remained super solid. This shows that there are buyers defending the price fiercely. That stability is what, according to the analysis, could provide the necessary momentum to bounce back and surpass that resistance line. If the breakout is confirmed, this would be a total game changer, transforming a bearish trend into a new bullish phase.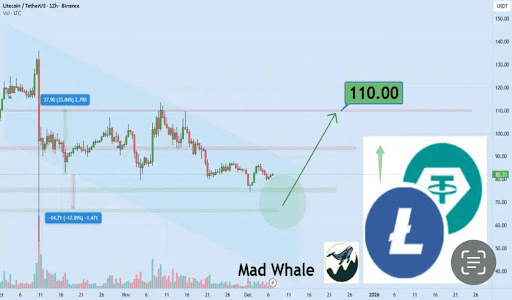
Be careful, because things are not just rosy. LTC is as volatile as lightning. At the beginning of October, it rose more than 33% (up to $120) and then, bam!, a few days later it plummeted 17% with the general market tremors. Currently, it is 79% below its all-time high of 2021 (over $410).
Another analyst, CW at X, gives us more details: the first important "ceiling" or sales limit is at $98. If we manage to break that barrier (where many will sell), the path clears towards the $106-$110 zone.
People, for now, are holding at a "neutral" point (neither fearful nor overly greedy), which means cautious optimism. The potential is there, waiting for the breakout.
So, to what extent is the constant support from buyers a real signal that people are ready to give LTC a boost despite historical volatility? We need to keep an eye on whether that ceiling of $98 becomes a springboard or a wall.$LTC


