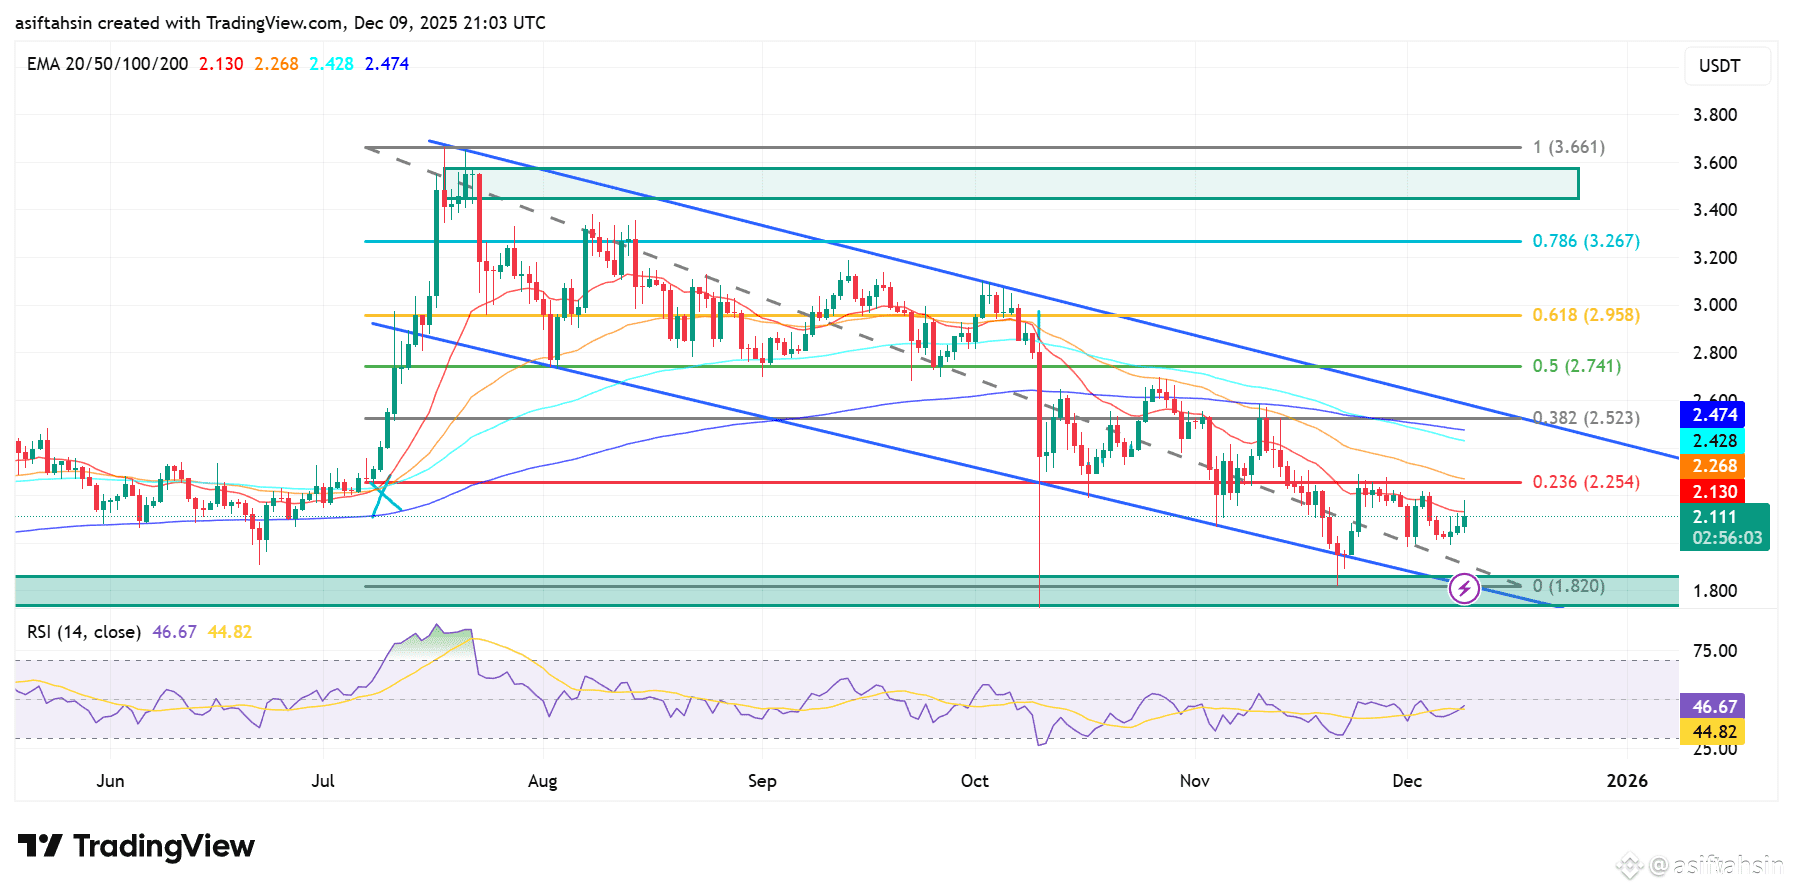
XRP continues to trade inside a well-defined falling channel, with repeated rejections from the upper trendline maintaining a bearish market structure. Recently, the price bounced from the $1.82 major support zone, which remains the strongest demand area on the chart.
Despite this bounce, XRP still struggles to gain upside momentum as it trades below the 0.236 Fibonacci level at $2.254, a resistance that has consistently rejected price attempts.
XRP is also trading below all major EMAs, reinforcing the bearish outlook:
20 EMA: $2.130
50 EMA: $2.268
100 EMA: $2.428
200 EMA: $2.474
All EMAs are sloping downward and positioned above the price, showing continued selling pressure.
A breakout above the falling channel and a daily close above $2.254 (0.236 Fib) would be the first clear signal of a possible trend reversal. If such a move happens, XRP could target the following Fibonacci levels:
$2.523 (0.382 Fib)
$2.741 (0.5 Fib)
$2.958 (0.618 Fib)
$3.267 (0.786 Fib)
$3.661 (1.0 Fib – previous swing high)
On the downside, losing the $1.82 support opens the door for a deeper correction and a continuation of the downtrend.
The RSI is currently around 46–47, showing neutral but slightly improving momentum.
📊 Key Levels
Resistance
$2.254 (0.236 Fib – key breakout level)
$2.523 (0.382 Fib)
$2.741 (0.5 Fib)
$2.958 (0.618 Fib)
$3.267 (0.786 Fib)
$3.661 (1.0 Fib)
Support
$1.82 major demand zone
Lower falling channel support
RSI
46–47 → Neutral; showing early signs of stabilization.
📌 Summary
XRP is holding above a strong support zone but remains inside a falling channel with all major EMAs acting as resistance. A breakout above $2.254 is essential to confirm a bullish shift. Until then, momentum stays weak and the broader trend remains bearish.
