Is XRP prepared for a breakout or is it bluffing again?
On the hourly chart, XRP is stuck in a volatile dance between $2.05 and $2.18, with price deviation from the upper boundary around $2.178. The recent bounce failed to maintain momentum, and sharp selling candles hint at indecision among short-term traders. Notably, the 10-period exponential moving average (EMA) is slightly below the current price at $2.09, while the 10-period simple moving average (SMA) is nearly at the same level – both provide minimal support.
Indicators such as the relative strength index (RSI) at 46.26 and the stochastic oscillator at 30.98 indicate a lack of overbought or oversold conditions, providing no foothold for traders to lean on.
If XRP holds support at $2.05–$2.07 with confidence, scalpers may sense opportunity, but a weak bounce below $2.15–$2.18 might require hedging.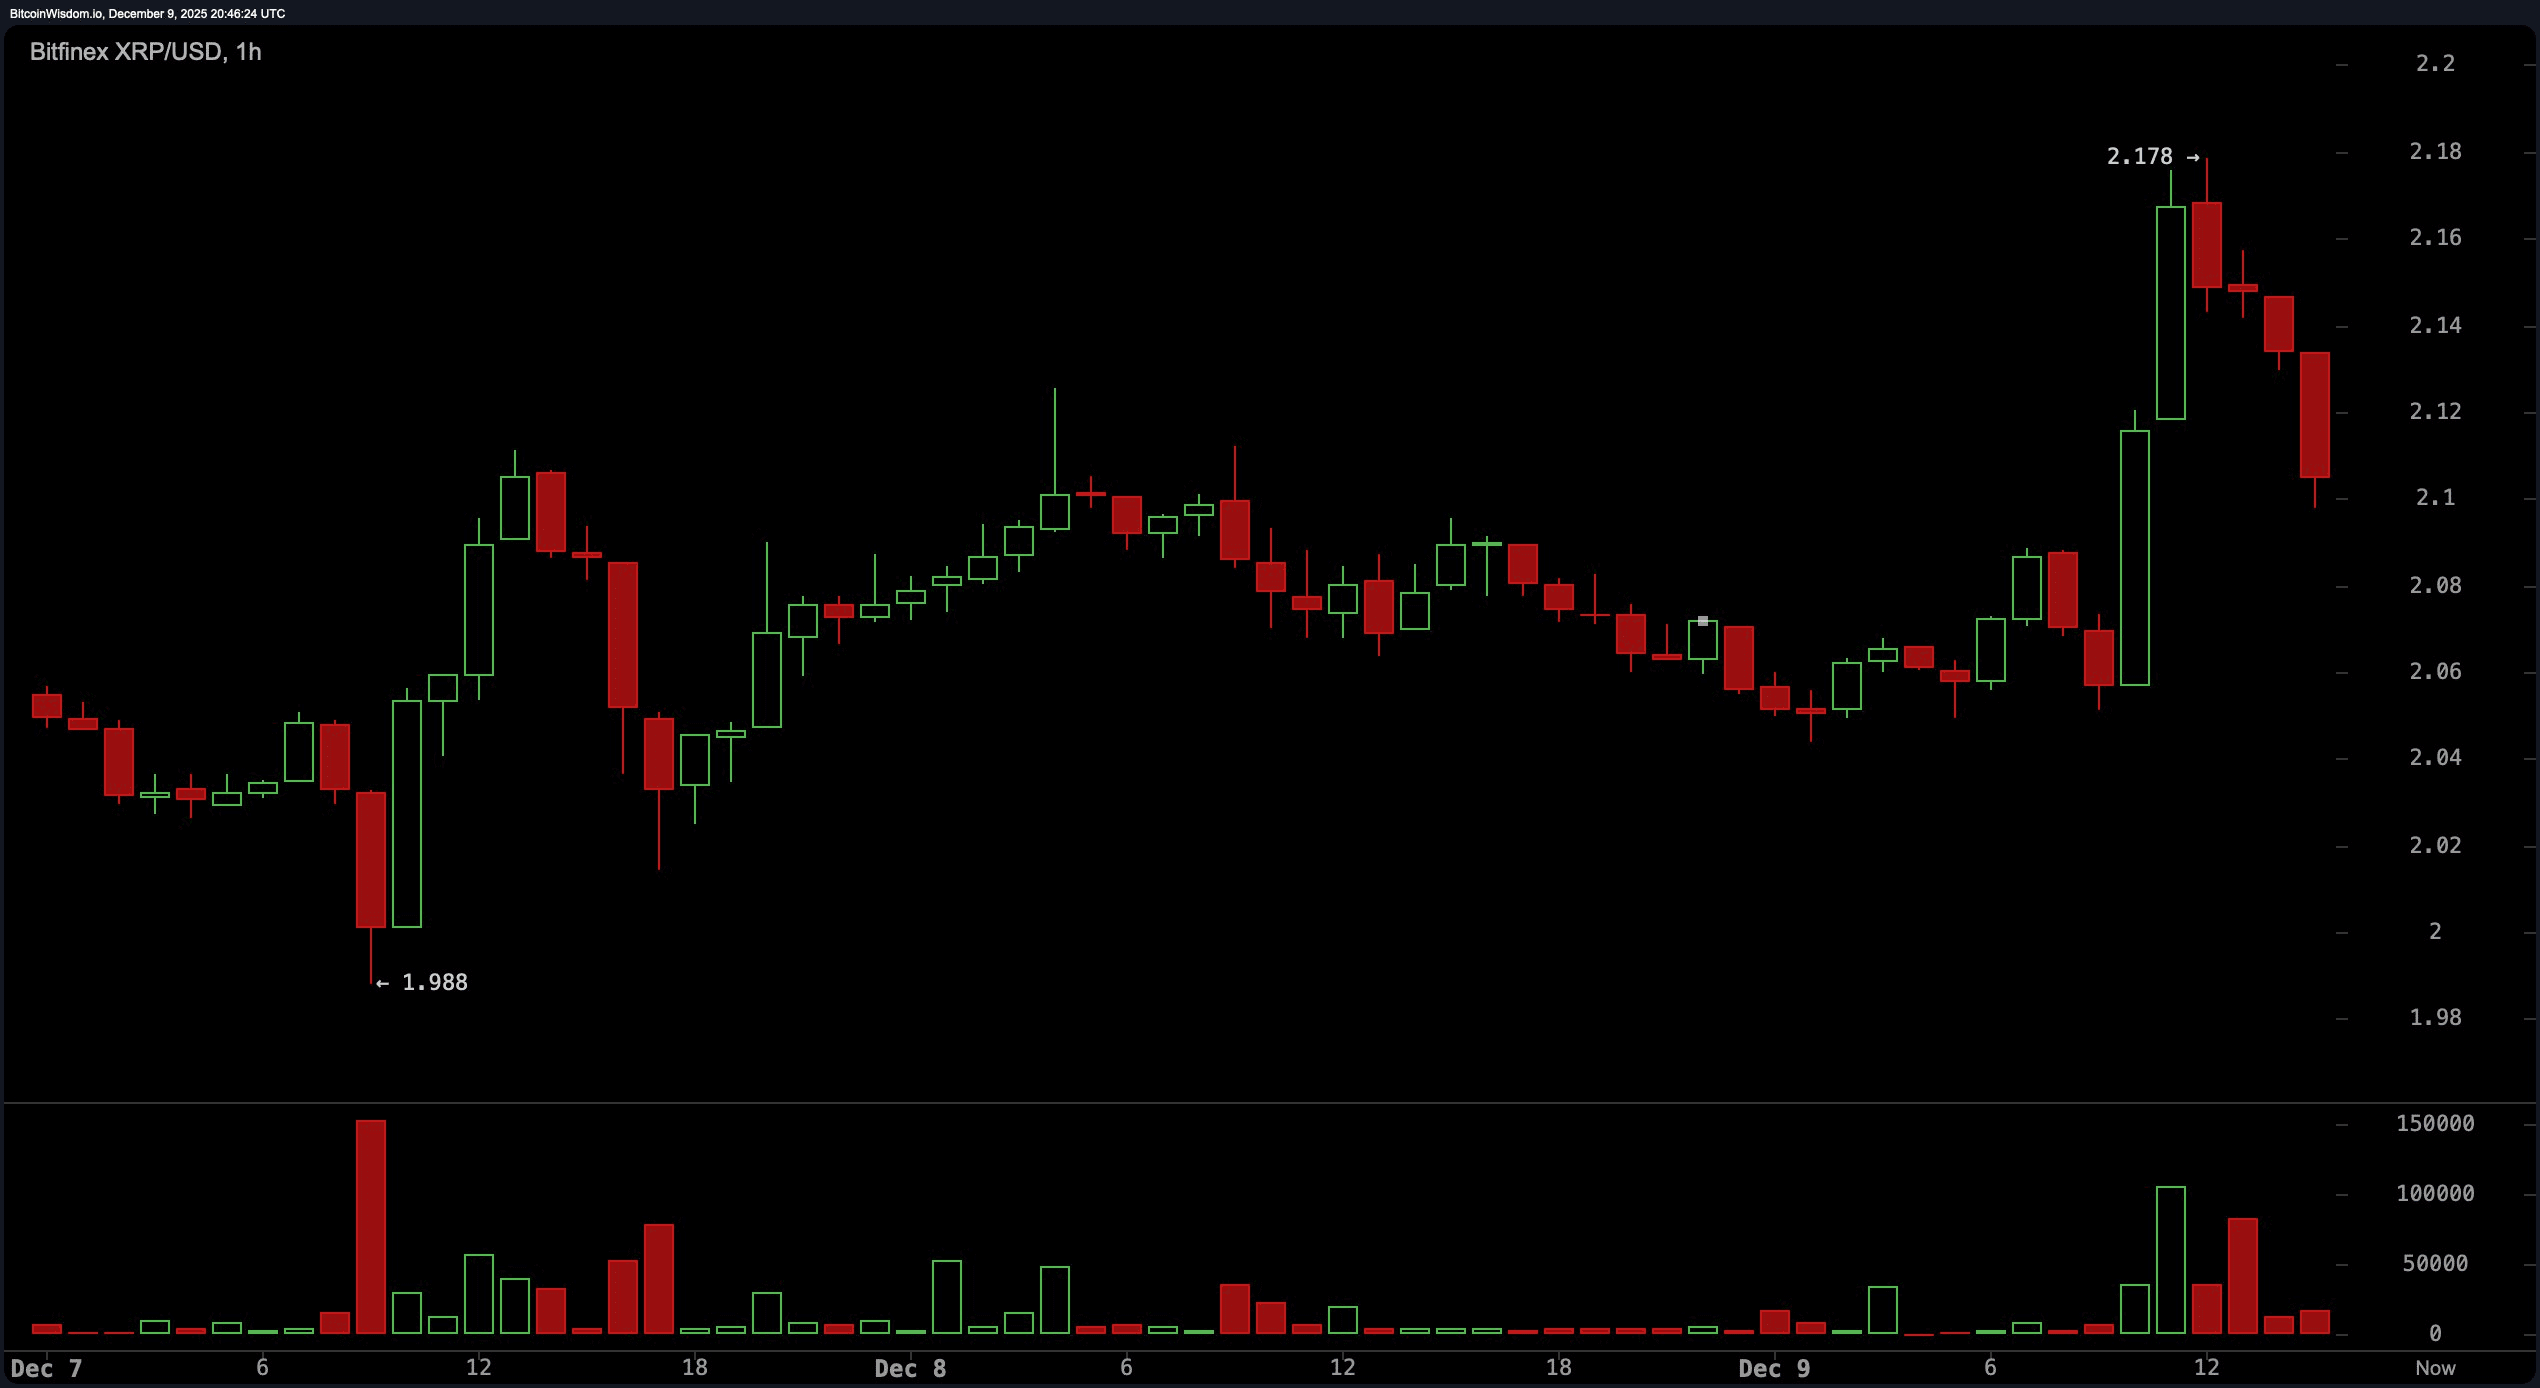
=========
Zooming in on the 4-hour chart, XRP shows faint signs of resilience, albeit wrapped in a veil of skepticism.
The recent bounce from $1.98 to $2.17 is losing momentum as the price returns to $2.12. A minor uptrend is forming with higher lows, indicating a soft attempt at reversal, though $2.22 remains immediate resistance to watch.
Volume spikes — green bars that make traders' hearts race — show a revival of buying on the dip, possibly foreshadowing bullish intentions.
But don't relax; if XRP stalls again at $2.22, the narrative could quickly revert to bearish déjà vu.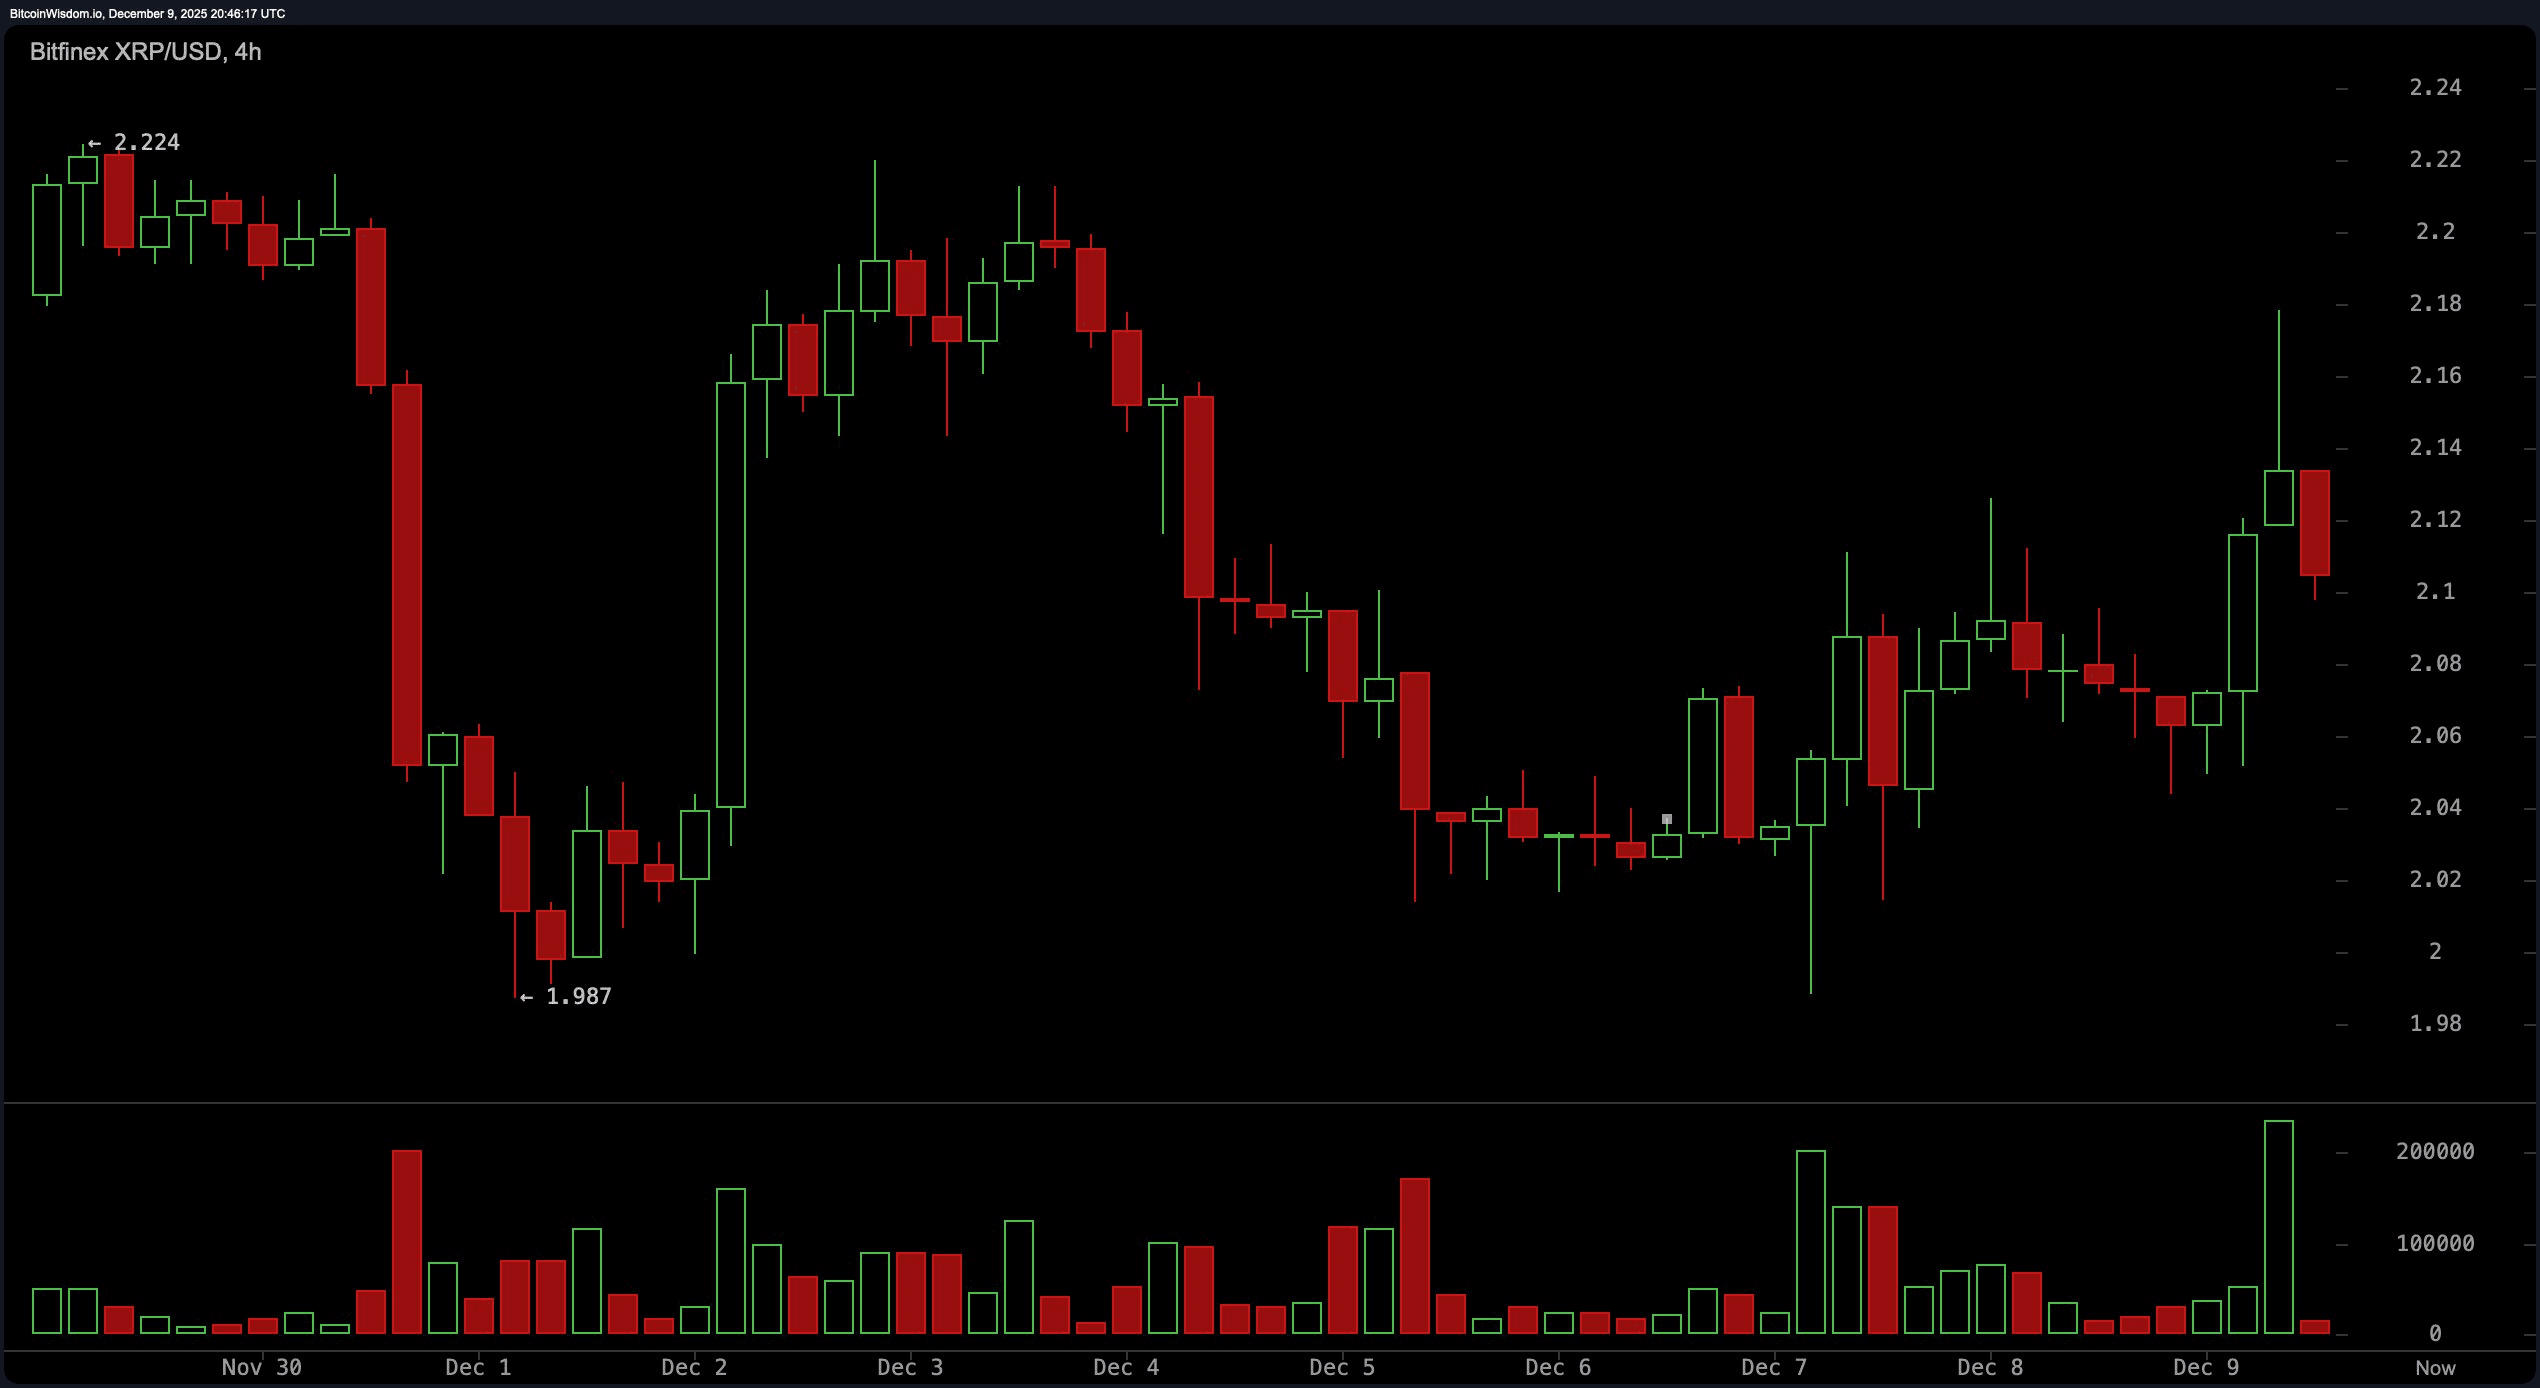
=======₪=
On the daily chart, the overall trend for XRP is clearly bearish, characterized by a series of lower highs and lows since the beginning of November.
XRP continues to hold onto a well-established support zone around $1.90–$2.00, which has repeatedly absorbed selling pressure. The volume profile on the daily chart shows a significant spike around $1.90, signaling a demand zone that traders are closely monitoring.
Momentum and MACD (moving average convergence divergence) show weak optimism with some positive signals, while other indicators, including the average directional index (ADX) at 19.14 and the commodity channel index (CCI) at 2.82, remain notably neutral.
Consolidation candles around $2.10 for XRP aren't screaming breakout, but whisper: “keep an eye on this spot.”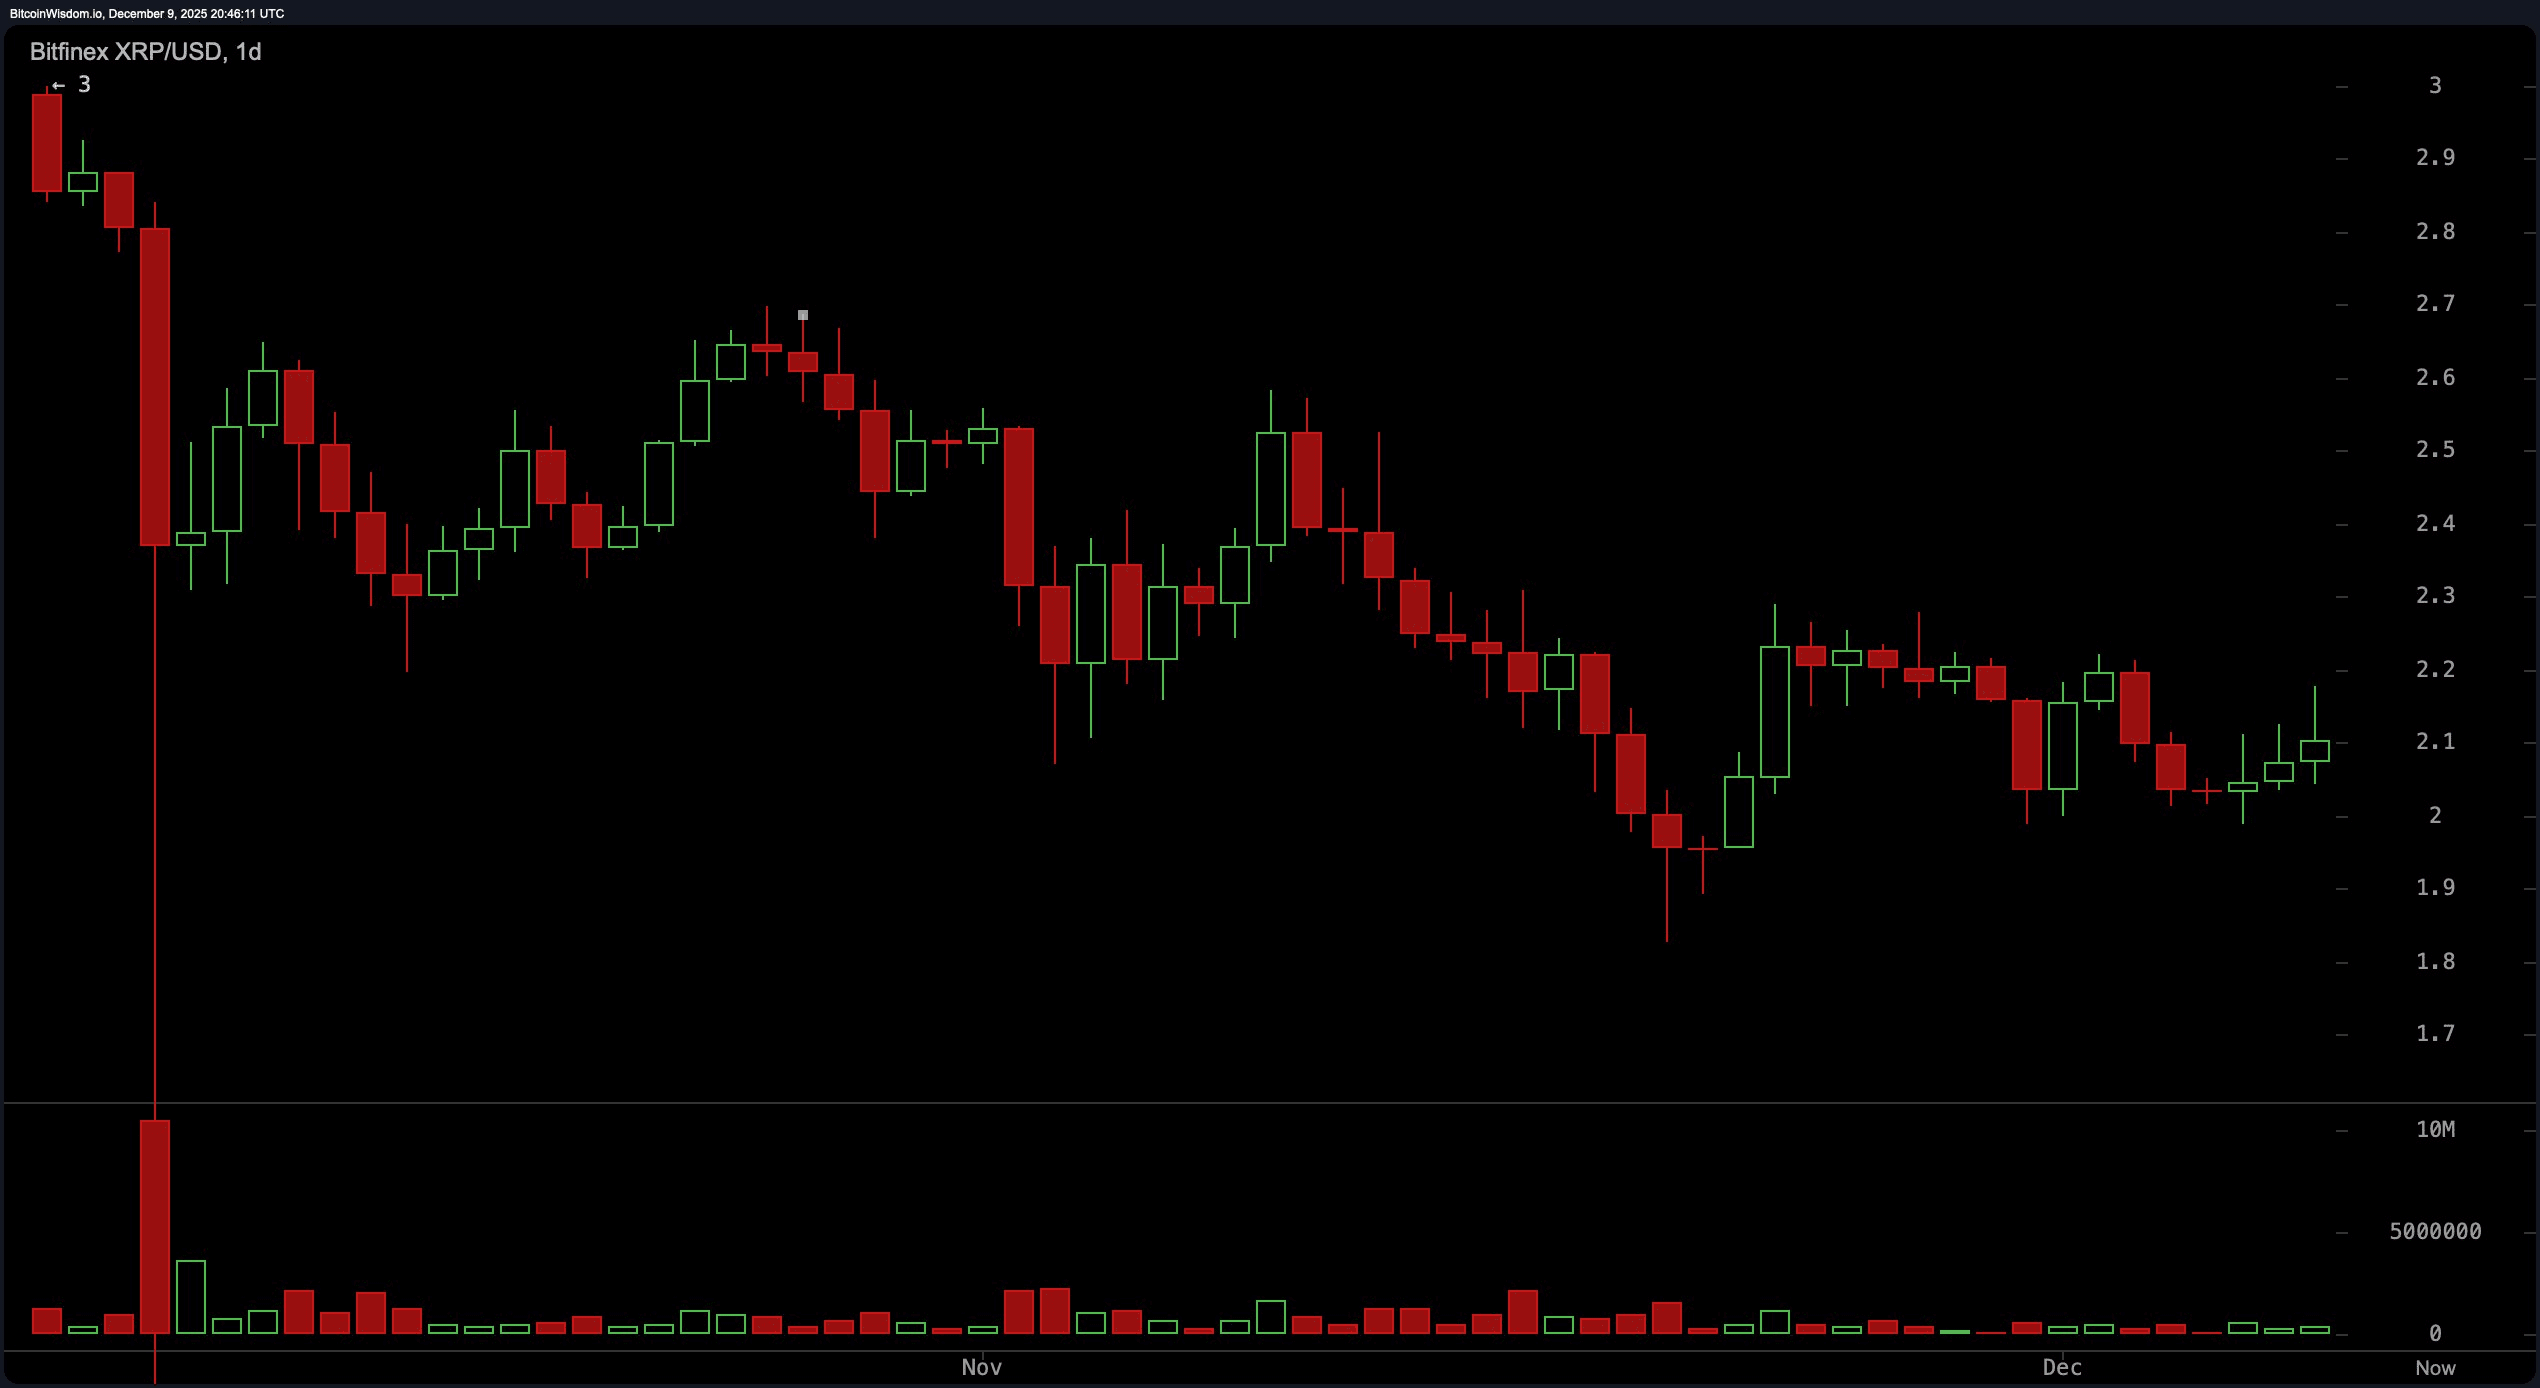
=========
Verdict for bulls:
If XRP can maintain support above $2.05 and gain momentum above $2.22 with confidence, technical indicators may decisively shift to its side. Short-term moving averages are already positioned for upward price pressure, and a clean breakout above $2.30 could awaken new market enthusiasm.
In this case, XRP is indeed gathering strength for a move that could break the current downtrend and bring it back to higher positions.
/=========
Verdict for bears:
The inability of XRP to overcome resistance at $2.22 combined with significant hurdles from long-term moving averages casts a long shadow over any bullish expectations.
The medium-term trend remains a decline, and with the daily structure continuing to register lower highs, any bounce may prove to be a mirage. If buying volume does not increase significantly, XRP risks returning to the $1.90 zone – and possibly going further.
