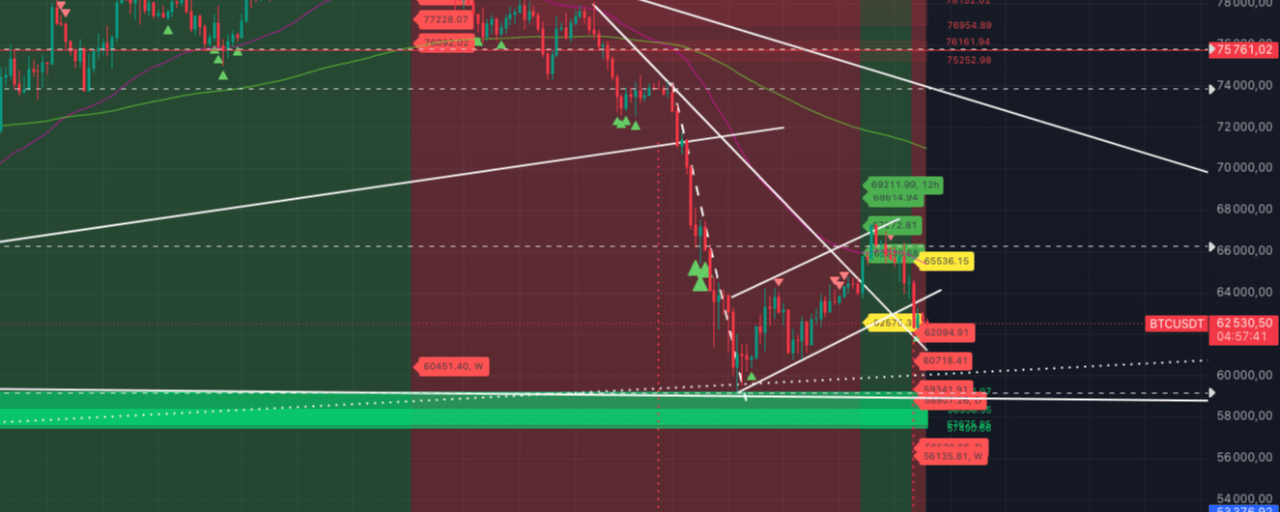

BTC still hasn't shown a proper bounce since yesterday, nor has it retested the exit from the 'Bear Flag'.
Yesterday's low of $62,272 was not broken. But the high from yesterday's small bounce at $63,274 also remains intact. The price is now in a range and continues to move in a structure of lower highs and lower lows.
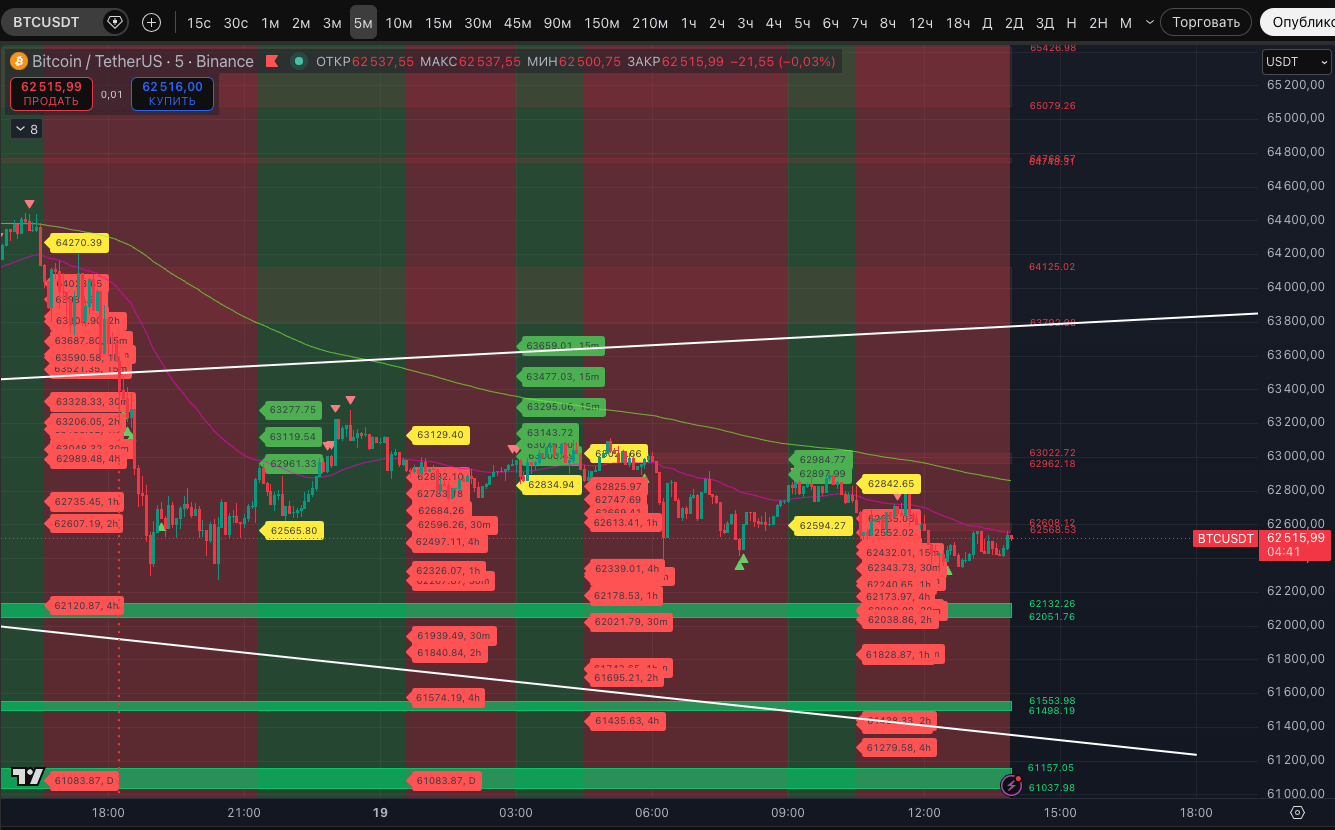
After closing our short at $62,854.3 (opened at $66,246.30), we continue to stay out of the market. We would like to enter a new short from a strong signal of a potential high on lower TFs, even from the 5-minute.
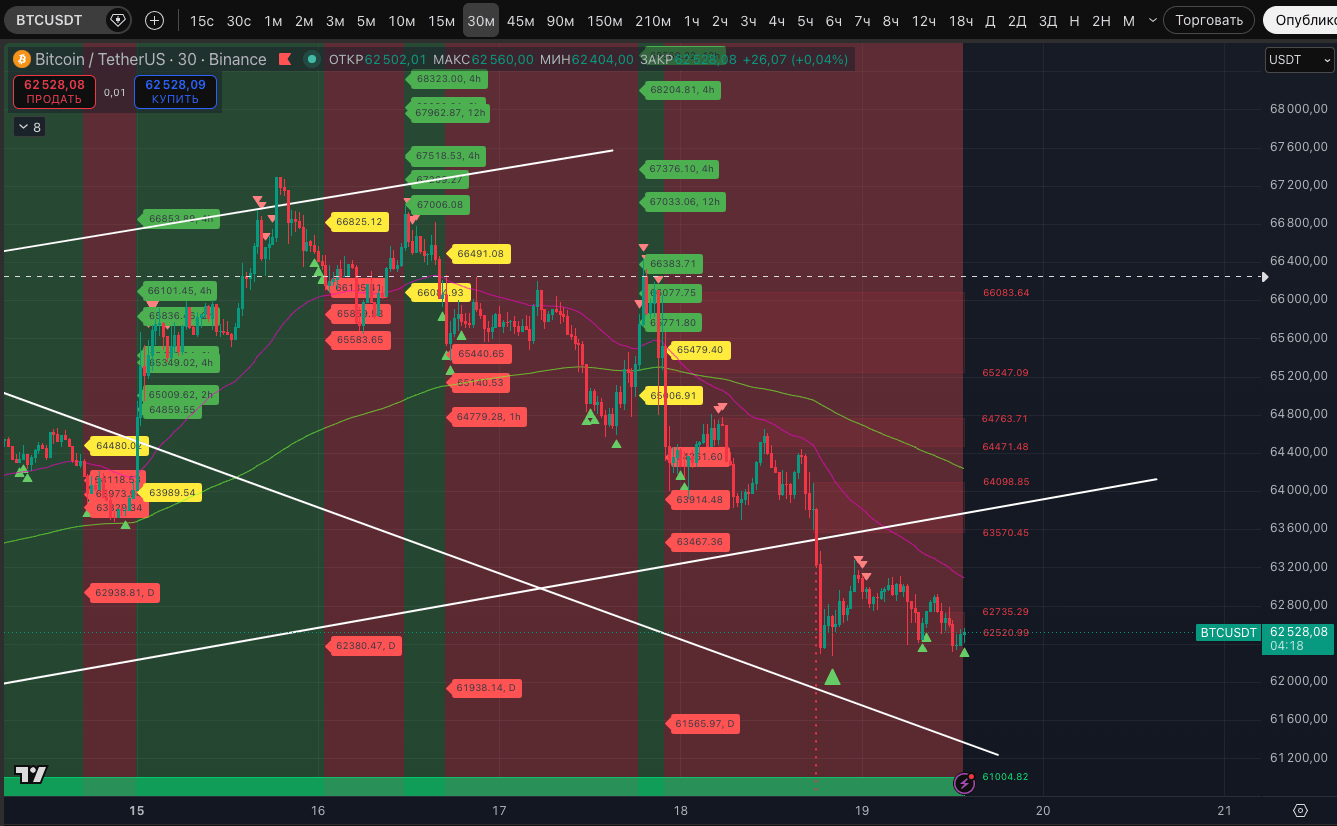
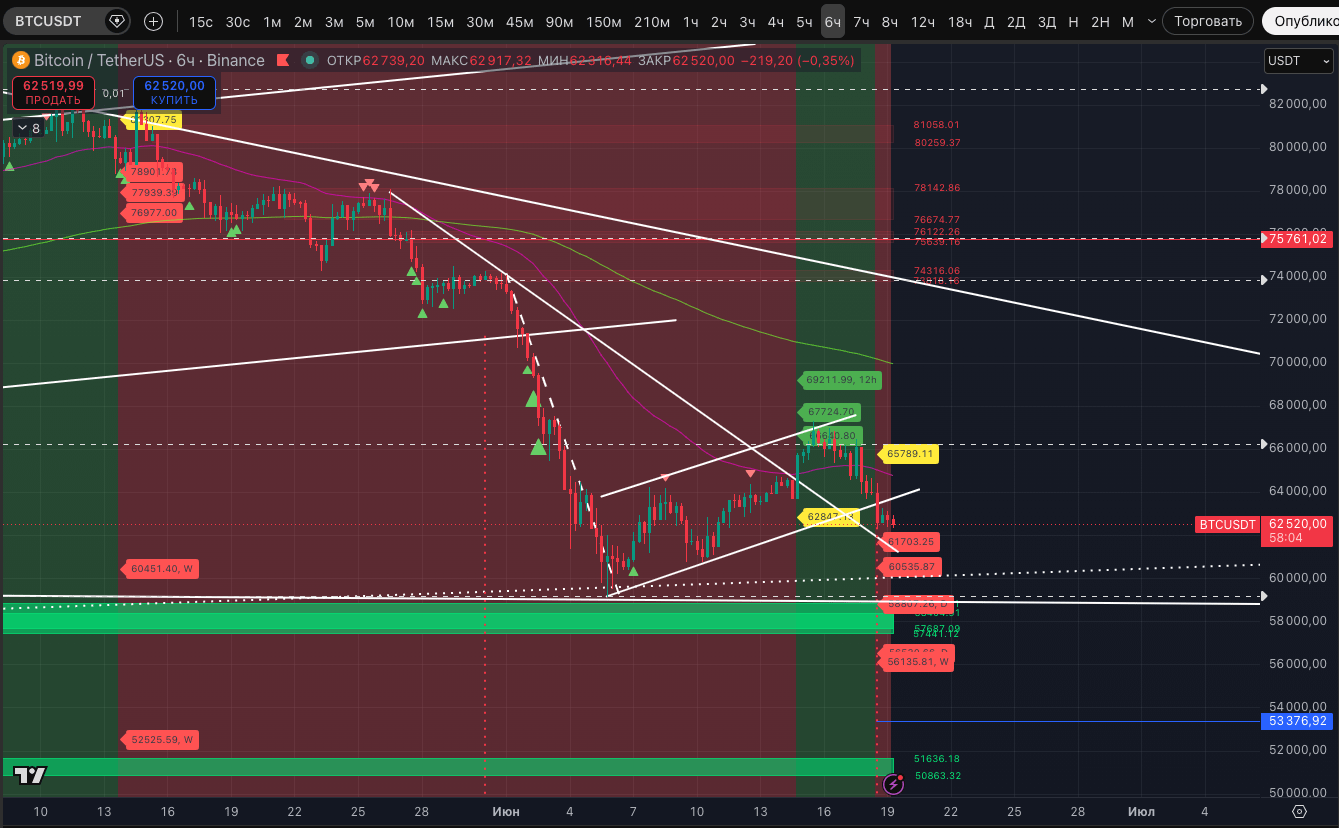
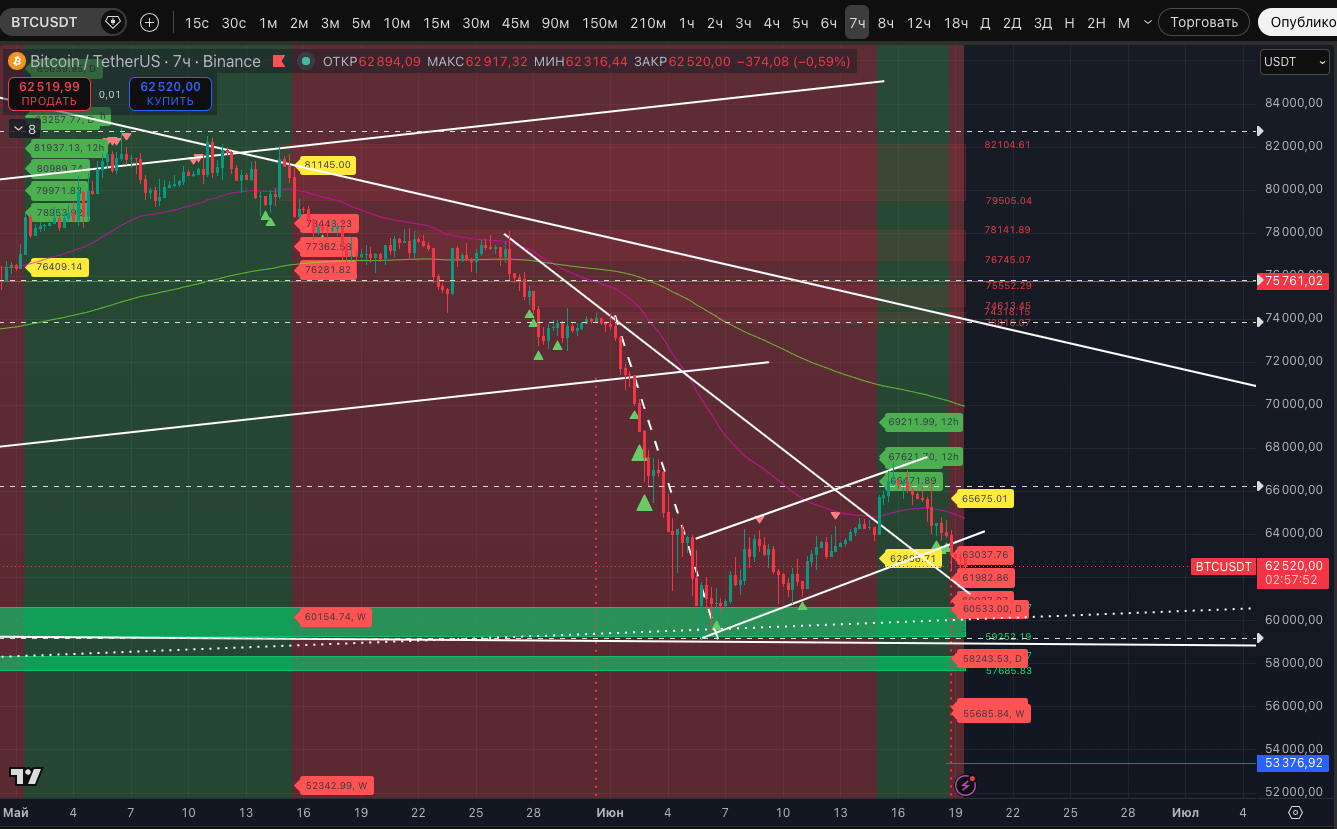
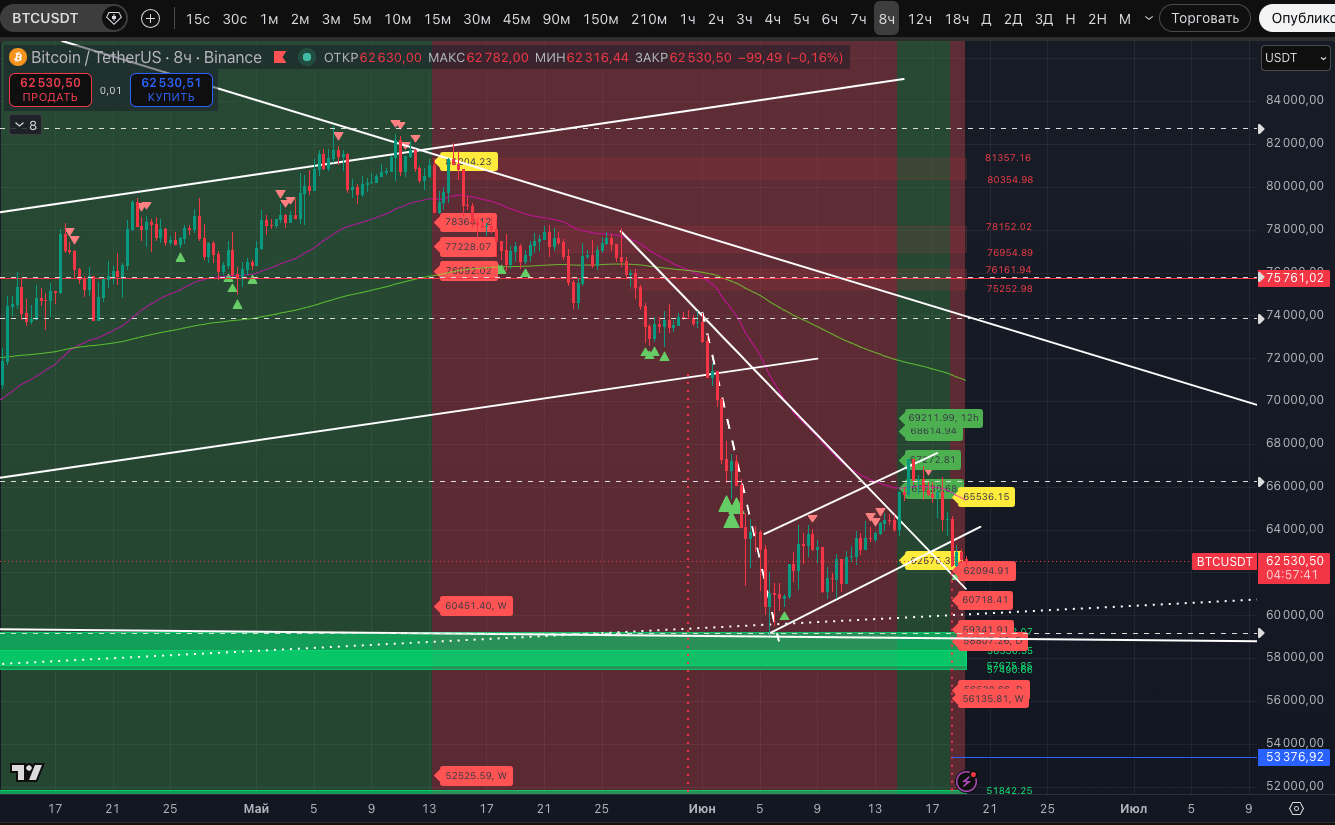
We're still considering a short as a relevant direction because our indicator sees it as a priority based on stable trends. After yesterday's impulse, the price broke stable uptrends on the 6-, 7-, and 8-hour TF. The targets and potential break levels are shown in the screenshots.
If the bounce is strong and confident, we will consider the levels of potential breaks of downtrends on these TFs as levels to enter a new short.
The only stronghold for the bulls remains the stable uptrends on the 12- and 18-hour TF. There, the price at the low is almost at the testing levels of potential breaks ($62,055 and $61,967 respectively).
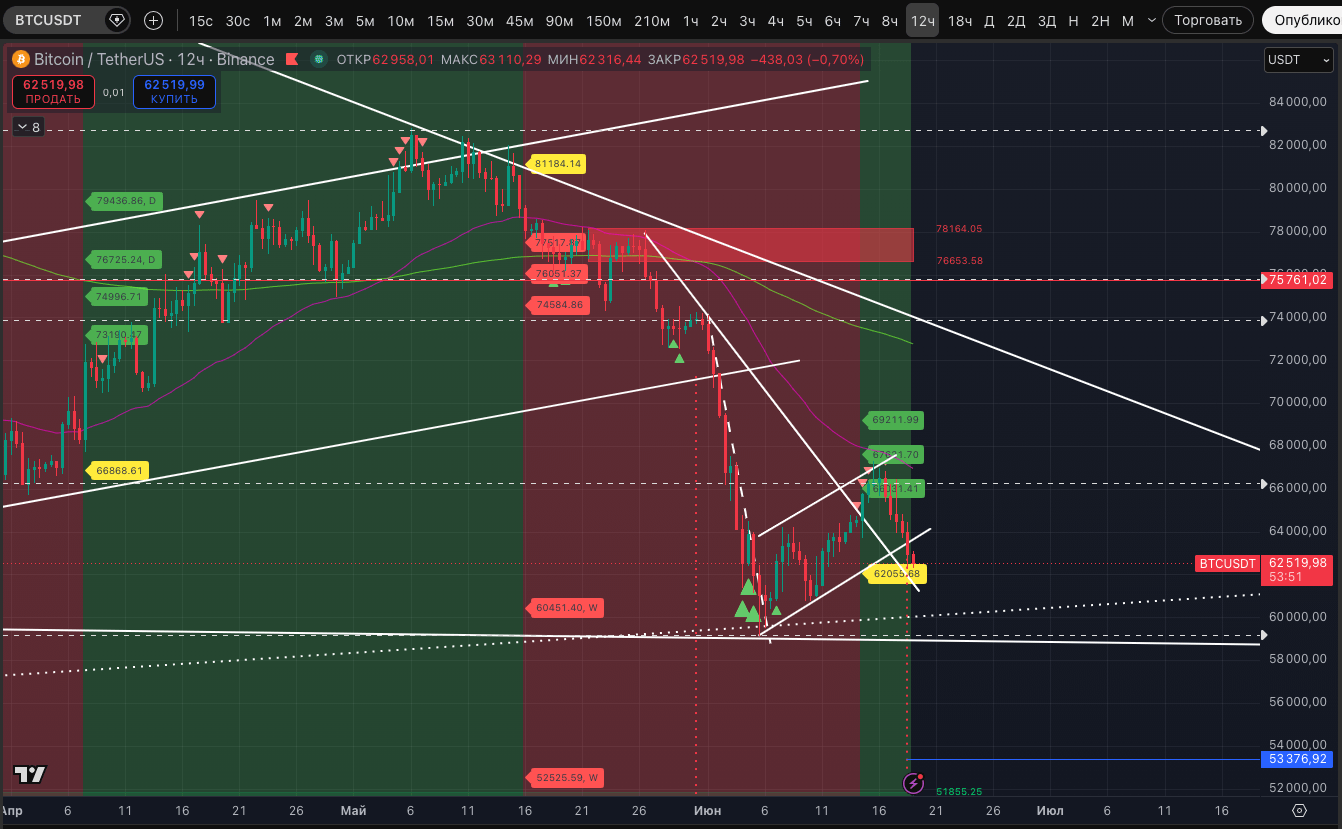
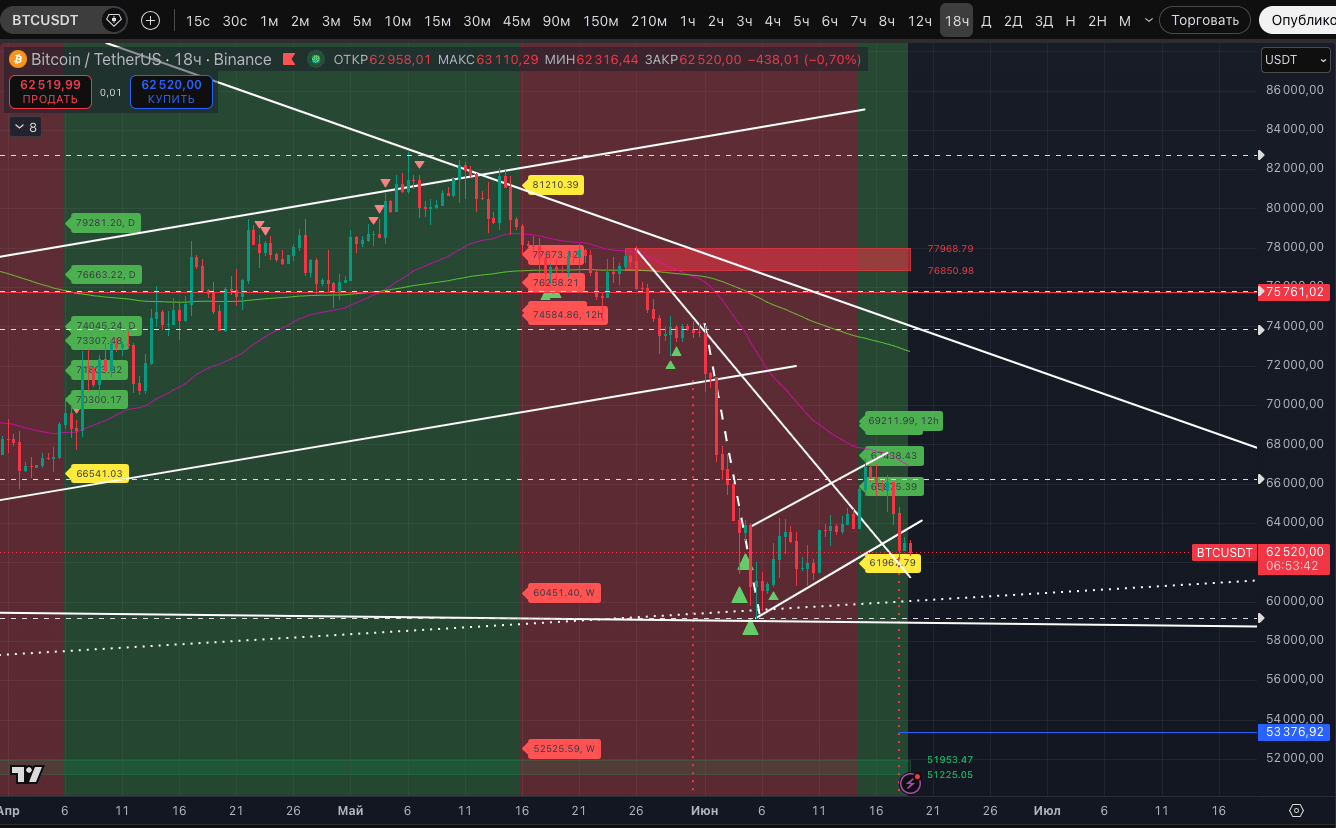
As long as the uptrends on the 12- and 18-hour TF hold, the probability of a bounce is strong and we continue to expect it. Moreover, we also consider that this might not just be a local bounce but a more significant upward move, with at least the basic targets of stable uptrends on the 12- and 18-hour TF being fulfilled. Therefore, for the potential new short, we will aim to secure a stop-loss in profit at the first reasonable opportunity.
But if the uptrends on the 12- and 18-hour TF get broken, the priority will be a downward move without a significant bounce. With at least a partial fulfillment of the 'Bear Flag' (its targets, as a reminder, are $53,376 and $48,502).
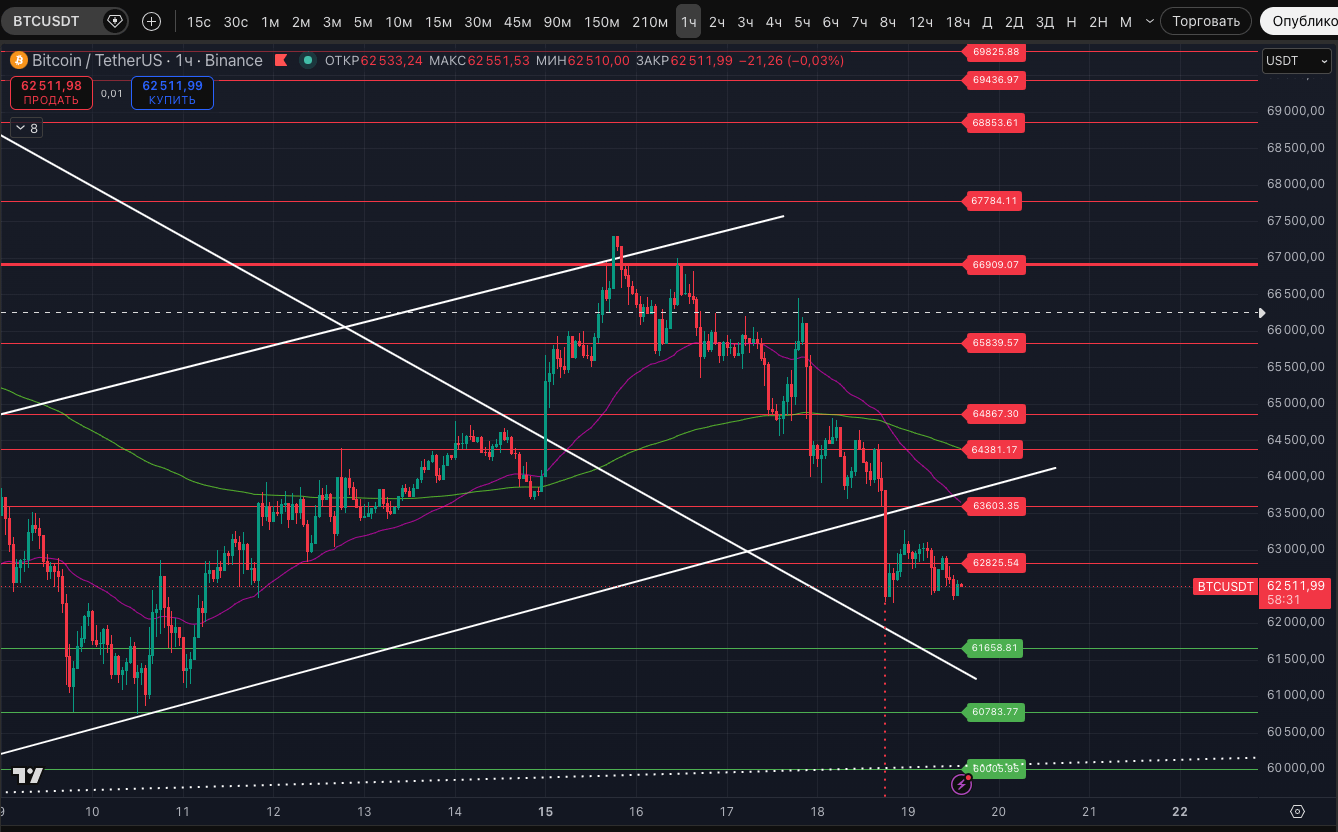
On the horizontal levels at the hourly TF, we show the picture on a separate screenshot. So far, the level $62,825 continues to act as resistance. While the price is below, it aims for the next support at $61,658. All other important levels as supports and resistances are indicated on the chart.
I would like to separately remind you of the global trendline from the lows of the entire growth since 2022 (in December 2022, September 2023, June 2026). It is indicated on the chart with a dotted line. It was tested during the dump at the beginning of June. Right now, it is around $60,000 and continues to act as support.
For a fast turnaround to growth in June, we can fall as low as $48,502. For maximum pain. The main thing afterward is to recover above around $68,000 by the end of the month. The same goes for July if we see a bounce now, and if a drop to new lows happens in July. Why is it important to close months above approximately $68,000? Because otherwise our indicator will show a stable downtrend on the monthly TF. And even if there are no new lows after that, exiting the downtrend can take considerable time, even until the end of the year.