The chart below👇 is called 'Percentage of Excess Liquidity Relative to Bank Deposits.' This is a very interesting indicator that can be understood as a barometer of market liquidity conditions. This time, the Federal Reserve is injecting $40 billion into the market every month, which essentially addresses liquidity pressure issues.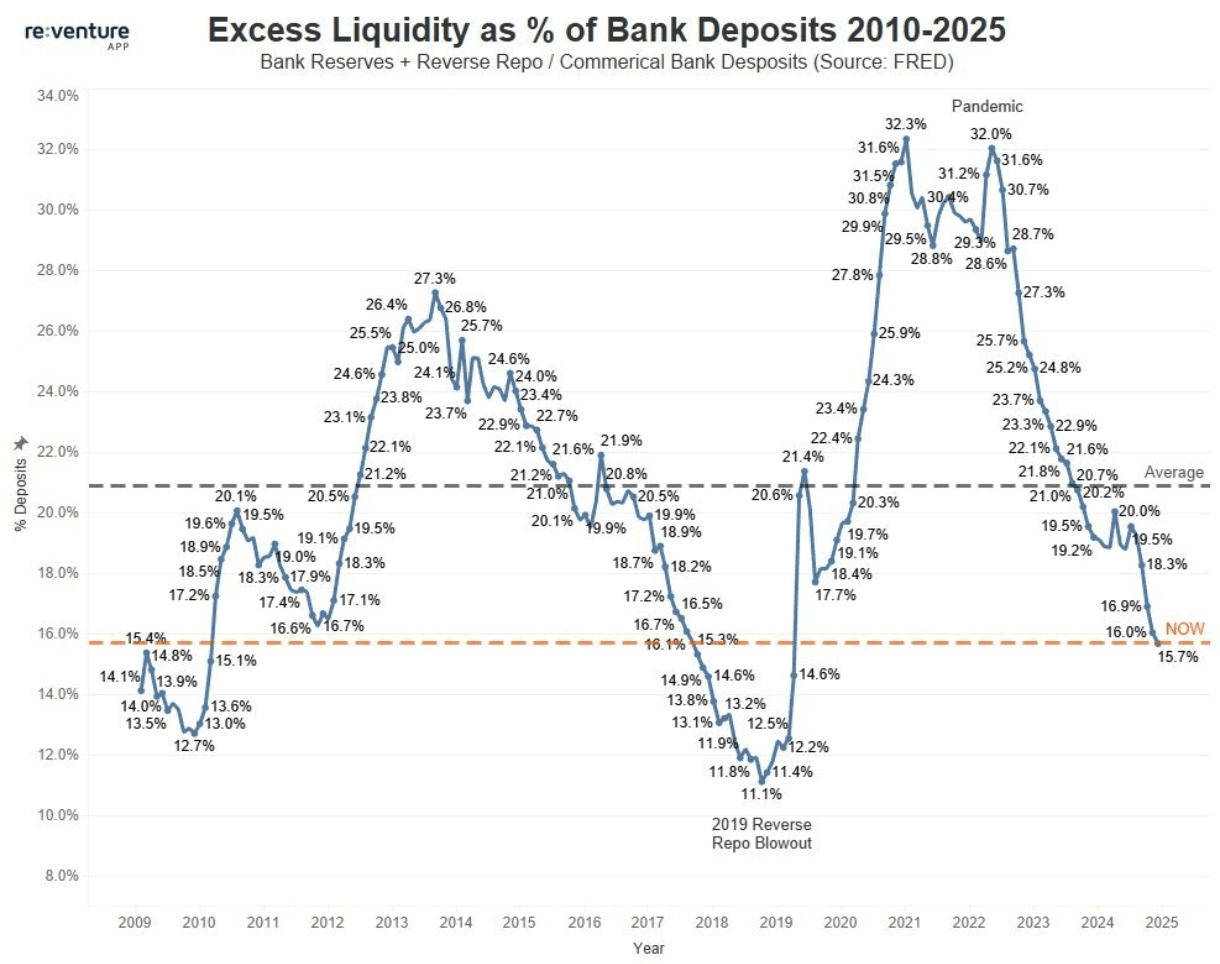
From the chart, we can see that it has currently broken below the gray dashed line's average (about 20.6%) and has reached a historical low near 15.7%. Historically, each time liquidity recovers, it brings value restoration to risk assets.
Looking back at the past 15 years🧐:
2009-2013: Early QE, liquidity gradually accumulated. After the financial crisis, the Federal Reserve initiated QE, and bank reserves began to increase, with the proportion of excess liquidity steadily rising from 12.7% to over 20%.
2014-2018: The end of QE and balance sheet reduction, liquidity moderately declined. The Federal Reserve stopped bond purchases in 2014 and began 'balance sheet reduction' in 2017 (reducing the size of the balance sheet). The growth rate of liquidity slowed, and due to inertia factors, there was even a slight decline in 2018-2019, ultimately falling to a low point (11.1%) in September 2019, triggering a 'repo storm.'
2020-2021: Pandemic QE, liquidity flooded in to respond to the pandemic shock. The Federal Reserve restarted unlimited QE, and the balance sheet expanded dramatically, with bank reserves and reverse repo balances surging. The proportion of excess liquidity reached a peak of 32.3% in 2021, flooding the market with 'excess' funds, causing various assets to skyrocket.
2022-2024: Interest rate hikes and balance sheet reduction, liquidity rapidly shrank to combat high inflation. The Federal Reserve began an aggressive interest rate hike cycle while simultaneously conducting 'quantitative tightening' (QT), which means stopping the reinvestment of maturing bonds and letting them naturally mature out of the balance sheet. This led to a significant decrease in bank reserves, with the proportion of excess liquidity dropping from a high of 32% to around 19.5% by the end of 2024, close to historical average levels.
2025—2026: Liquidity has basically started to rebound from the bottom. The current data is 15.7%, lower than the historical average line (20.6%), and also below the level at the end of 2024. This indicates that, after more than two years of tightening, the liquidity of the banking system has returned to a relatively 'tight balance' state, even slightly tense.
Since liquidity has bottomed out, combined with the Federal Reserve's monthly $40 billion repo actions starting in December, there is no need to be overly pessimistic. The rebound of liquidity is a highly probable event in the long term! Winter has come, but is spring far behind? 🧐$BTC

