The Chart Speaks: Why is the AT Ignoring the Moving Average? Decision Point is NOW!
🔥 Deep Technical Analysis: AT $0.1142
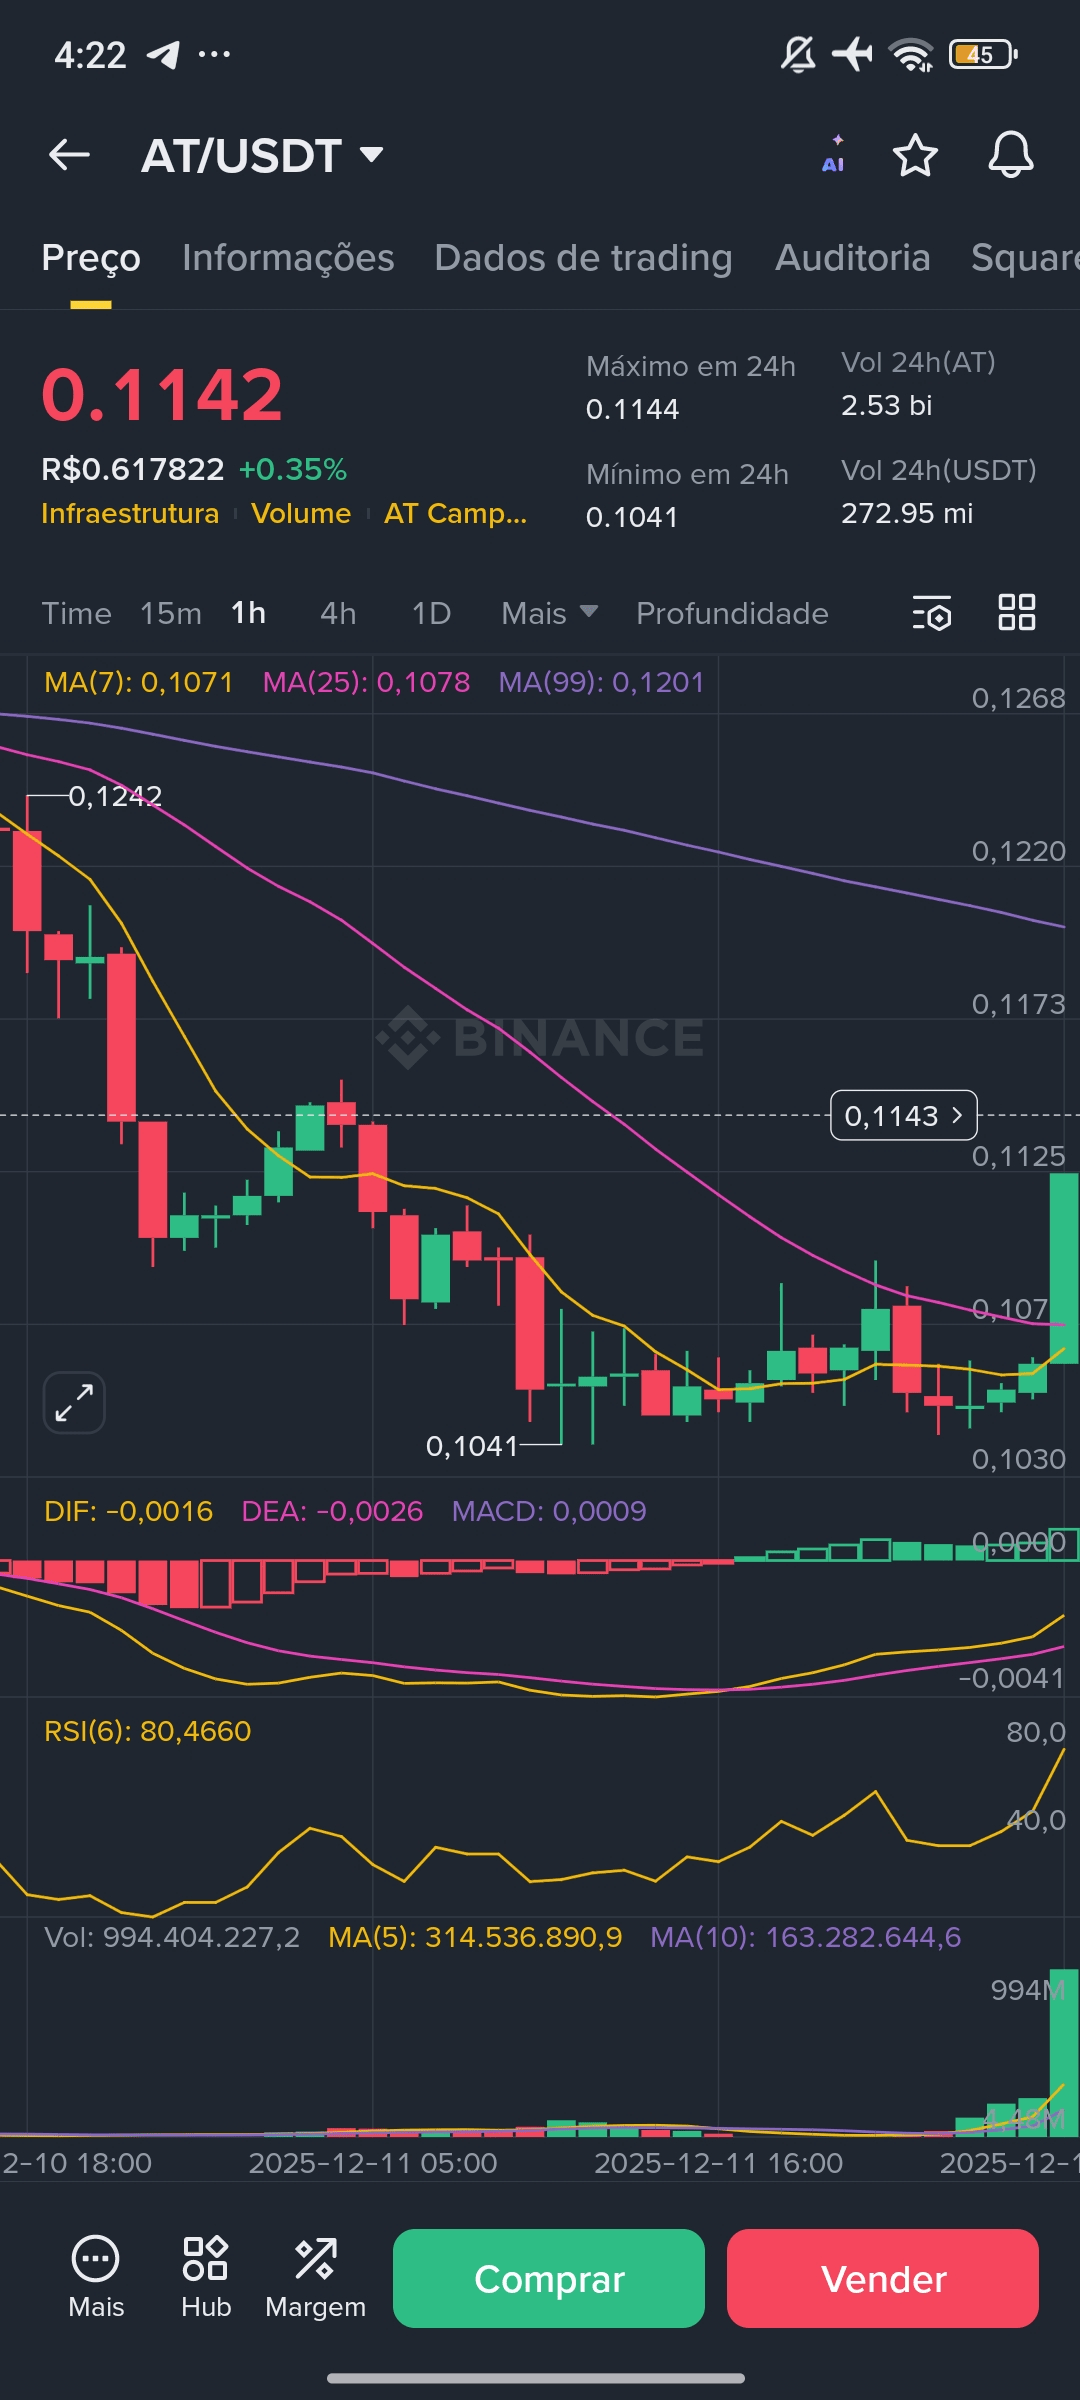
Binance Square Community, pay attention! The AT/USDT chart shows that we are at a moment of maximum tension. The current price, at $0.1142, is caught in a squeeze between the Short and Long-Term Moving Averages. This indecision is what precedes major movements.
What the 1H Chart Tells Us (Current Data):
Indecision of the Moving Averages (MA): The price is dangerously floating close to the MA(7) at $0.1071 and the MA(25) at $0.1078. If the price falls and closes firmly below $0.107, we will have a signal of weakness in the short term.
Major Resistance: The MA(99), at $0.1201, is acting as a significant psychological and technical resistance. Breaking this level is the signal that the bulls (buyers) need.
Volume and Liquidity: The 24h volume at $AT is robust, at 2.53 billion $AT (or 272.95 million $USDT). This means that any movement will be amplified due to high liquidity.
📉 The MACD and RSI Alert
The indicators show a divergence of signals, complicating decision-making and this is where the engagement opportunity lies:
MACD (Recent Sell Signal): The DIF is negative (-0.0016) and the DEA is negative (-0.0026), with the MACD at 0.0009. This indicates that short-term selling pressure has dominated.
RSI (Overbought Signal?): The RSI(6) is at 80.4660. WARNING! An RSI above 70 generally suggests that the asset is overbought and may be ready for a correction. This is a clear alert for longs (buys).
1. Optimistic Scenario (Driven Buy)
The price needs to break the 24h high of $0.1144 and close above the MA(99) at $0.1201. If this happens, the RSI may cool off quickly with new buying volume, leading the AT to test the next levels at $0.1242 (recent resistance) and beyond.
2. Pessimistic Scenario (Imminent Correction)
If the high RSI is a precursor to a correction and the price falls below the MA(7) ($0.1071), the risk is high. The next key support is the 24h low at $0.1041. Breaking this level opens the way for a deeper correction, validating the MACD's downtrend.
Warning: This is not financial advice. Do your own research.