Bitcoin has recently shown a significant narrowing of volatility, with the candlestick chart oscillating around a narrow range for several consecutive days, and the forces of bulls and bears are in a brief balance. Currently, it is at a key node for choosing the direction of the breakout. The formation of this pattern is derived both from the technical convergence of the range and is deeply tied to the market's cautious sentiment after the macro-level favorable conditions have faded.
From a key point of view, the upper $94,000 area has formed a clear structural resistance zone — this position is not only a dense area of trapped positions from previous highs and subsequent declines but also resonates with the upper Bollinger Band on the daily chart and the 60-day moving average, creating resistance that has been tested multiple times without effective breakthrough, becoming a barrier that is difficult for short-term bulls to surpass. The support below has steadily moved up from the previous $86,000 to around $89,000, and this change is not merely a technical correction; rather, it benefits from the enhanced buying strength after multiple bottoms in this range. On-chain data shows that there is sustained spot buying at around $89,000, forming the core defensive line for short-term bulls.
At the macro level, the Federal Reserve's previous 25 basis points rate cut has completely faded away. Powell's statement of 'pausing further rate cuts' has cooled the market's expectations for liquidity easing, causing risk assets to lose their core upward driving force and shift focus to the subsequent economic data guidance. The upcoming non-farm payroll report and other key data will become important catalysts for breaking the current volatile pattern—if the data falls short of expectations (employment cooling), it may briefly boost the market's expectations for easing; if the data is strong, it will reinforce the Federal Reserve's hawkish policy logic, further suppressing market sentiment.
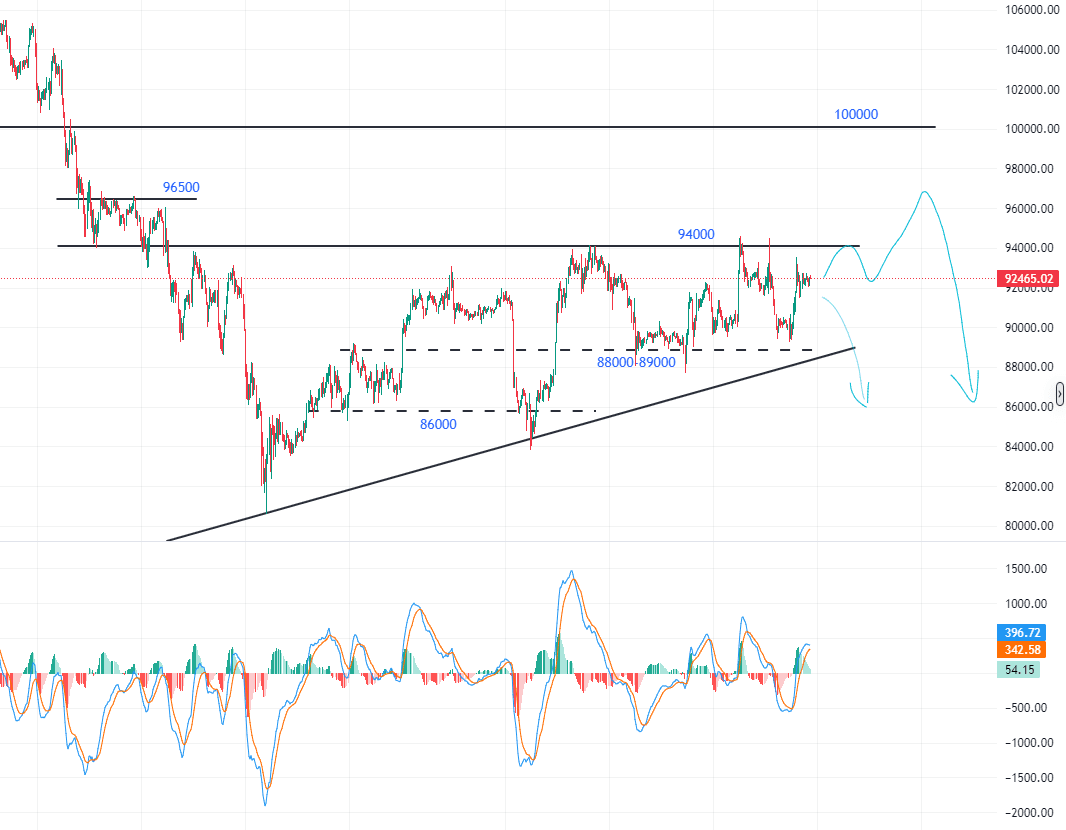
Regarding the future market trend, there are currently two main core scenarios: First, if the market can utilize favorable data to break above the $94,000 resistance level in the short term, it may rebound and test the $96,000-$100,000 area. However, considering the insufficient macroeconomic easing expectations and the heavy positions above, the rebound is likely to struggle to sustain and will return to a corrective trend after a rise. Second, if the $94,000 resistance continues to hold and lacks supportive favorable data, a pullback may begin directly, first testing the $89,000 support. If this level fails, it may further decline to the $88,000 integer mark. If market sentiment deteriorates or unexpected negative news arises, a deep correction is likely to reach the previous strong support at the $86,000 area, which will determine the final direction of the short-term trend as it served as the starting point for the previous rebound.
The core strategy of the current market needs to focus on 'breakout confirmation'. It will maintain volatility until a clear breakout from the range is established, at which point we can consider following the trend.
