
Solana showed weakness in the recent session and slid towards the $131 area after failing to maintain an initial recovery. Market data indicated increased activity and persistent selling, as traders were assessing whether the token could hold steady near its short-term support.
Solana Price Prediction: Focus on support levels after sharp declines.
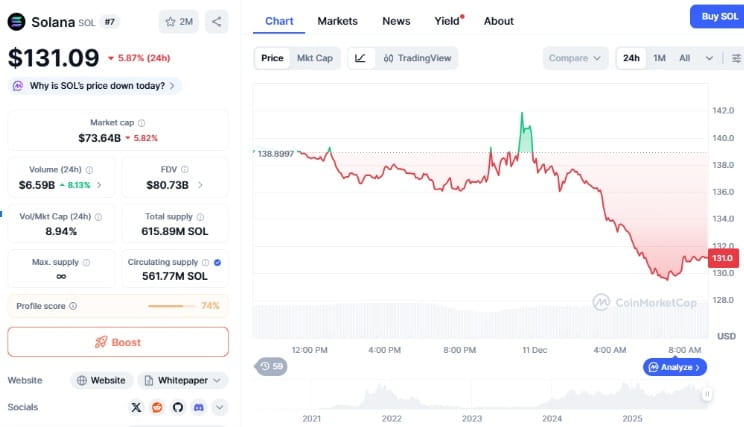
$SOL The price fell from the morning high of $142 to around $131, indicating weakness throughout the day's trading.
According to CoinMarketCap:
Approximately 6% decline in 24 hours.
Market cap: Approximately $73.64 billion.
Trading volume: Increased by over 8%.
This increased volume indicates that traders are adjusting their positions in anticipation of a decline.
Many traders are keeping an eye on whether Solana can hold above the key support area.
Source: CoinMarketCap
The chart showed a decline after a short spike, indicating that sellers are still in control at higher levels.
$130 has shown to be an important support zone, tested multiple times over the last several sessions.
The circulating supply has been approximately 561.77 million, which is about 91% of the total supply—these figures have shown stability with market valuation and have been included in short-term Sol predictions.
Momentum indicators showed slight improvement. Downward momentum has decreased somewhat after a sharp decline at the end of November. This is not yet a reversal signal, but the market appears to be building a base if the right support is found.
Solana Price Prediction: Technical levels and trend signals.
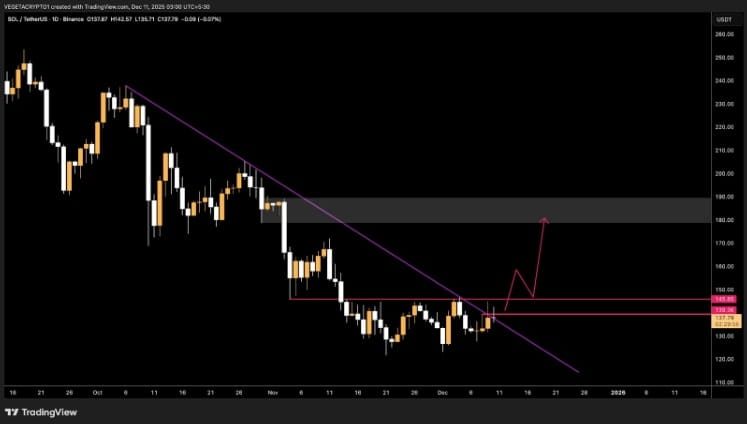
The TradingView chart shared by analyst VΣGΣƬΛ.OKX (@VegetaCrypto1) shows the potential for a structure shift in Solana if it crosses the key resistance.
According to the chart:
A descending trendline has been in place since October.
The price is currently testing its lower range around $137.
This area has been a repeated reaction zone in the recent downtrend.
Source: X
According to the chart, if Solana closes above $145.85, then:
$180–$190 upper target zone could open up.
This indicates a potential increase of about 30–38% from the current price.
This setup resembles a break–retest–continuation pattern, which traders often look for to confirm trend reversals.
However, the chart also displayed a rejection scenario—
If Solana cannot move above the trendline, then:
$130,
$125,
$120,
and deeper declines could activate levels down to $110.
Since the breakout attempt has not yet shown strong volume, traders are waiting for clear signals.
Solana Price Prediction: Monitoring significant resistance for breakout signals.
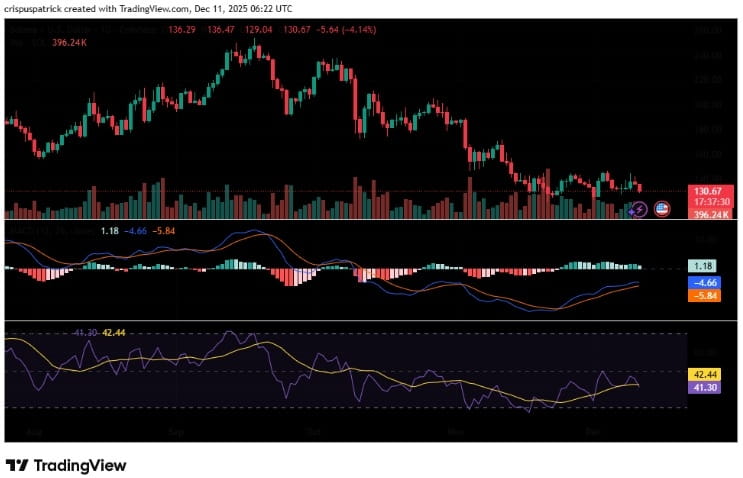
The MACD on the daily timeframe recently recorded a bullish crossover, indicating a slowdown in the rate of decline.
RSI is around the level of 41—which indicates that Solana is still range-bound but is emerging from the oversold zone that occurred at the end of November.
Source: TradingView
Currently, Solana is trading in a narrow range of $130–$140.
The first sign of new buys in the market will come when the price:
First, go above $138.9
and then close above $142.
Until then, traders are speculating on the next Solana price prediction and broader crypto price prediction analysis by observing volume and chart behavior.
Disclaimer
This analysis is based on market trends and does not guarantee future results. Do not consider it financial advice. Investing in cryptocurrencies is risky—be sure to do your own research (DYOR) before any investment.
To Know More:- Crypto Hindi News
#CryptoHindiNews #india #BestCryptotoBuyNow #hindi #PricePrediction
