Today, while watching the market, I found BCH to be interesting. The one-hour chart is clearly still falling, but the MACD has quietly 'golden crossed' - is this to lure in more buyers or a real rebound? Don't rush, I'll help you break it down layer by layer.
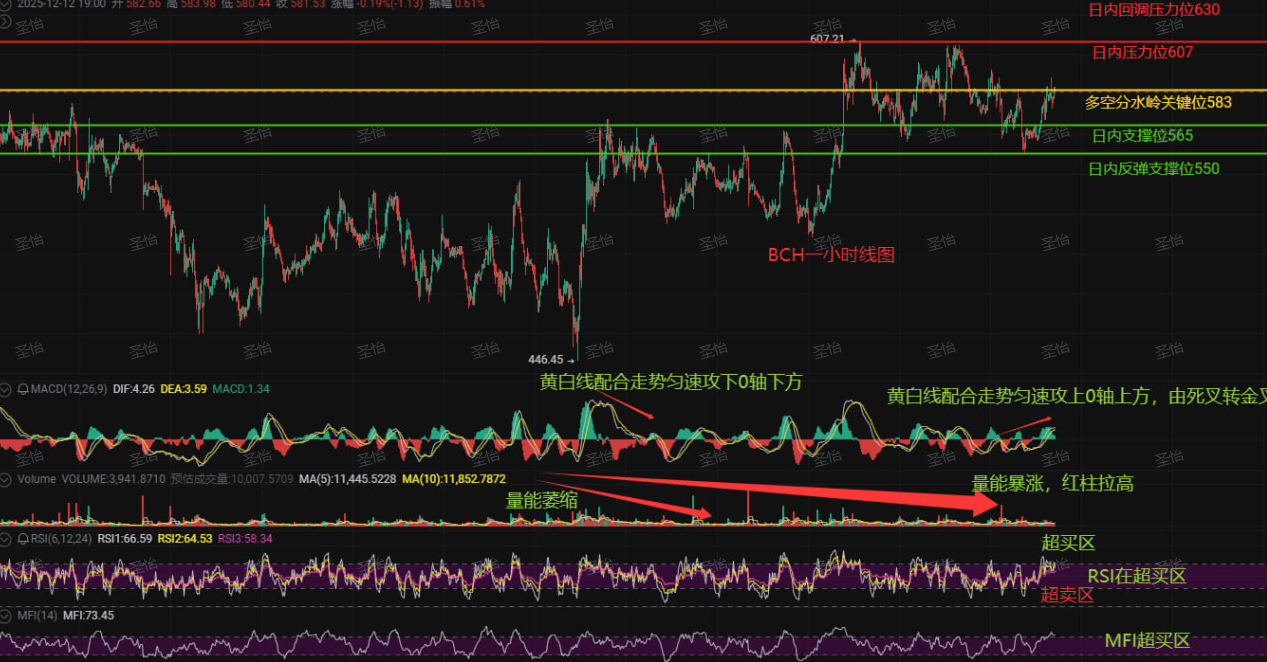
First, look at the key level above 607 as the first resistance, 630 as strong resistance; below 583 is the bulls-bears dividing line, if it breaks, then watch 565, even 550. Although the market is still in a downward channel today, pay attention to a detail: the yellow-white line has already been steadily climbing above the 0 axis, which is a signal of short-term momentum reversal. But don't rush to shout 'the bull market is here,' because - the volume has not continued to expand, and the RSI is still hovering near the overbought area, what does this indicate? The upward movement is likely just a false move.
Now let's look at the liquidation data:
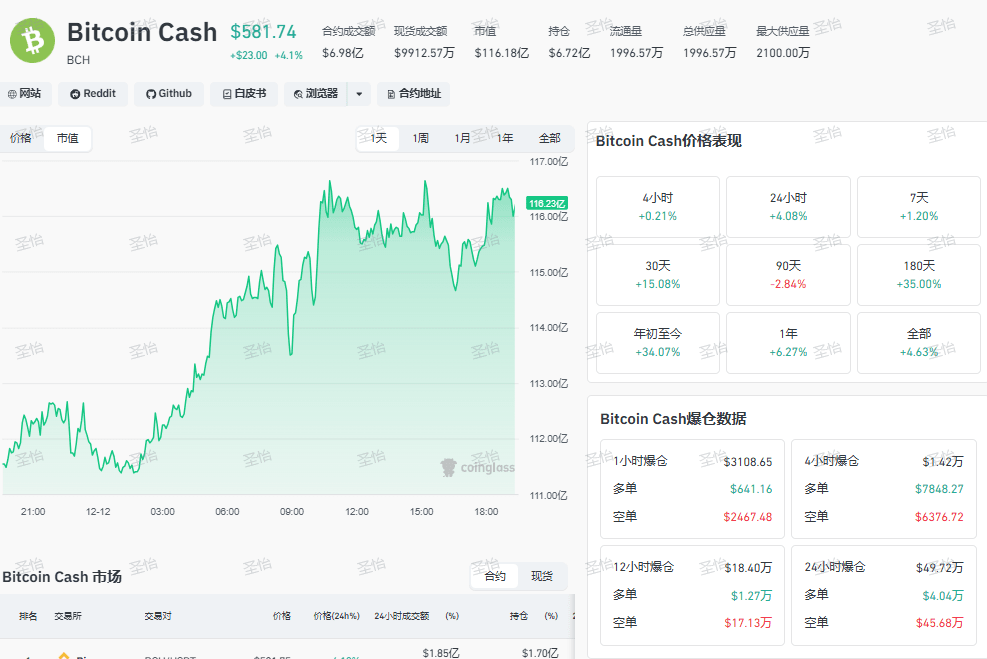
In the last 24 hours, short positions exploded by 450,000 USD, while long positions only reached 40,000. With so many shorts being buried, the market hasn't really taken off; doesn't it feel a bit like 'it should rise but doesn't'? Here, I want to point out something many people haven't noticed: a lot of liquidations ≠ immediate rise; it may instead mean that the main force is cleaning out the opposing positions, and there might be another wave of decline ahead.
What should players do:
In the short term, look for a fluctuation in the 583-565 range. If it stabilizes at 583, you can take a small position for a rebound, but be sure to reduce your position or exit near 607. If it breaks below 565 directly, don't try to catch the bottom; the next observation point is around 550. Remember, the initial stage of a MACD golden cross is often a period of fluctuation, not a charging phase.

Currently, my view is very clear: BCH is still bearish in the medium term, but there is a short-term need for a rebound. If it first surges to around 607 today, that’s an opportunity for shorts; if it first drops to the 565-550 range, you can gradually buy a bit for a rebound. But make sure to keep your position light and always have a stop-loss.
Find the Holy Yi chat room: 【1143032750】 to learn how not to be fooled by false signals and how to capture the true trend initiation point. Recently, the market has been fluctuating, and many people are losing money not because they are wrong about the direction, but because they are wrong about the timing. Those unsure about timing can follow Holy Yi, who will provide real-time analysis in the village and give the current best entry points.
