Bitcoin (BTC) and Ethereum (ETH) are approaching major resistance zones in Friday’s trading session. A confirmed breakout could ignite a new bullish cycle. Meanwhile, Ripple (XRP) is stabilizing at a strong support level, hinting at a potential rebound if buying pressure strengthens.
Bitcoin (BTC): Strong Breakout Possible Above Critical Resistance
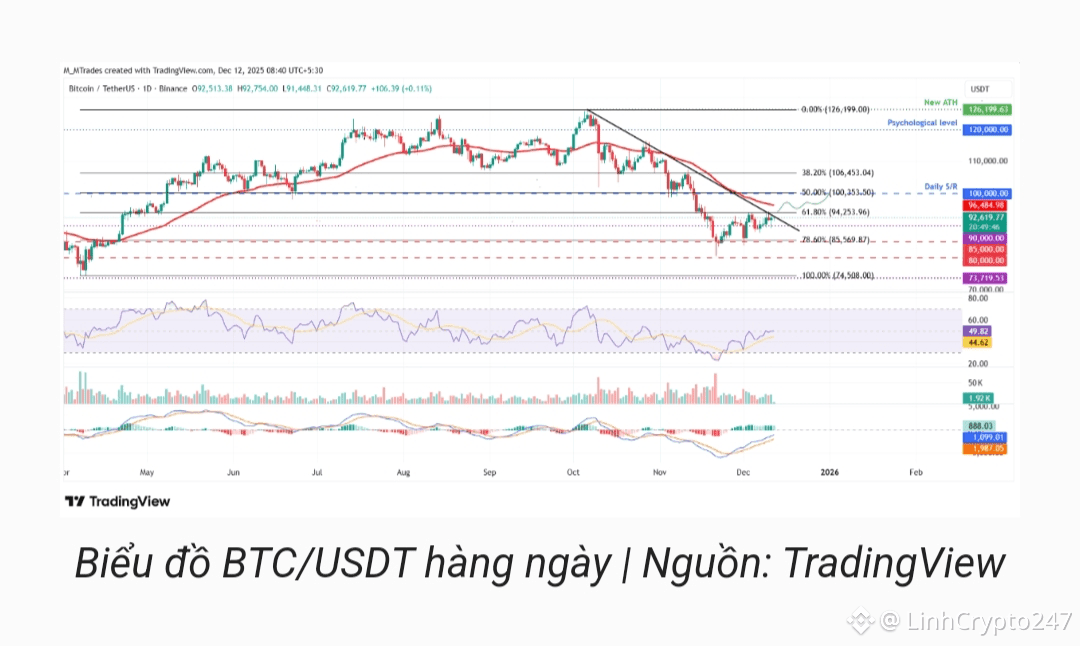
Bitcoin was rejected at the 61.8% Fibonacci retracement at $94,253 (measured from the April low of $74,508 to the all-time high of $126,199). This caused upside momentum to pause on Wednesday.
On Thursday, BTC regained strength after successfully retesting the psychological $90,000 level. As of Friday, price is consolidating around $92,000.
A breakout above the descending trendline and a daily close above $94,253 could open the door for a move toward the $100,000 psychological target.
Technical indicators support the bullish case:
RSI is climbing toward the neutral 50 level, showing weakening selling pressure.
MACD has maintained a bullish crossover since late November.
If sellers return, the next major support lies at $85,569 (78.6% Fibonacci).
BTC Trade Setup
Buy: $92,200
TP: $98,500 → $100,000
SL: $89,800
Ethereum (ETH): Bullish Momentum Expands if Price Holds Above the 50-Day EMA
Ethereum broke above its descending trendline (connecting highs since Oct 7), gaining 6.21% on Tuesday. However, price stalled at the 50-day EMA (3,310 USD) on Wednesday, leading to mild pullback before recovering on Friday.
If ETH can close firmly above $3,310, bullish momentum may extend toward the $3,592 resistance.
Indicators remain positive:
RSI has climbed to 54, above the neutral 50 line.
MACD continues to print a bullish crossover.
If selling pressure returns, ETH could revisit support at $3,017.
ETH Trade Setup
Buy: $3,250
TP: $3,590 → $3,950
SL: $3,080 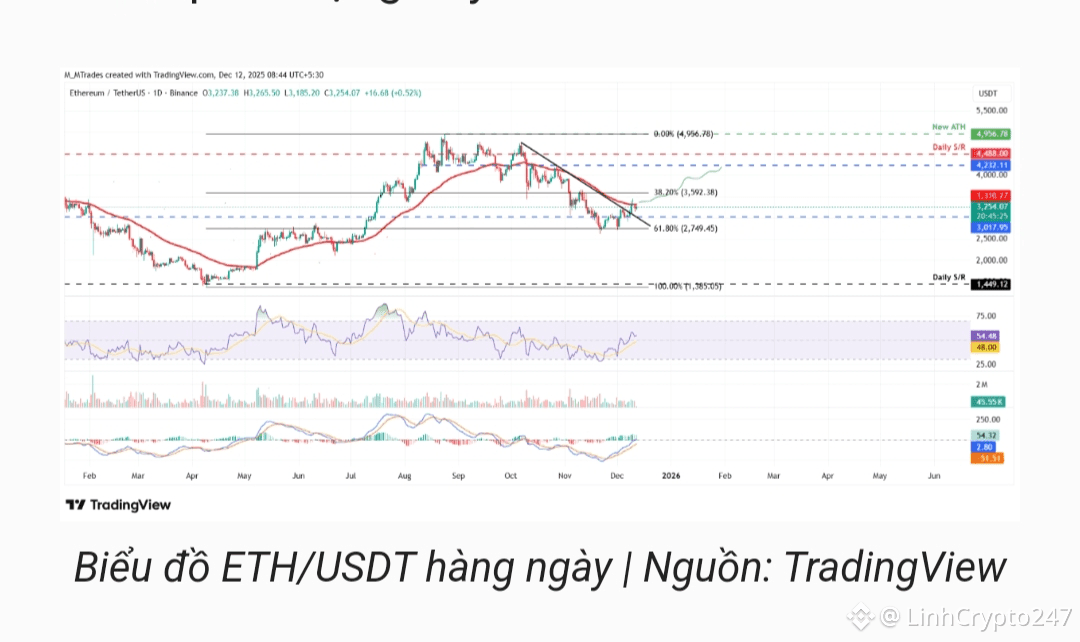
XRP: Holding Above Key Support Zone
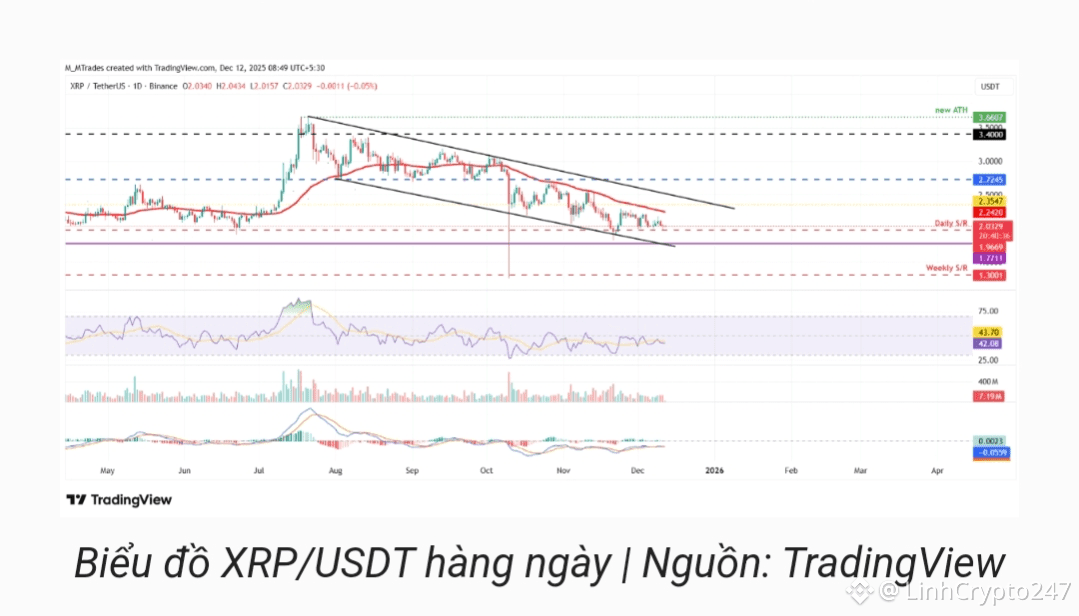
XRP bounced from $1.96 support on Sunday, gaining 3.66% over two days before strong selling on Wednesday erased gains. Price again retested $1.96 and is currently stabilizing around $2.03, reflecting cautious sentiment.
If the $1.96 support continues to hold, XRP may rebound toward the next resistance at $2.35.
Indicators show mixed signals:
RSI is at 42, heading toward the neutral 50 zone — a sign of weakening bearish momentum.
MACD lines remain convergent, signaling market indecision.
A daily close below $1.96 could send XRP down to $1.77.
XRP Trade Setup
Buy: $1.98
TP: $2.35 → $2.55
SL: $1.89
Follow for more fast market insights, TA breakdowns & smart trading setups!


