🔍 Overall View
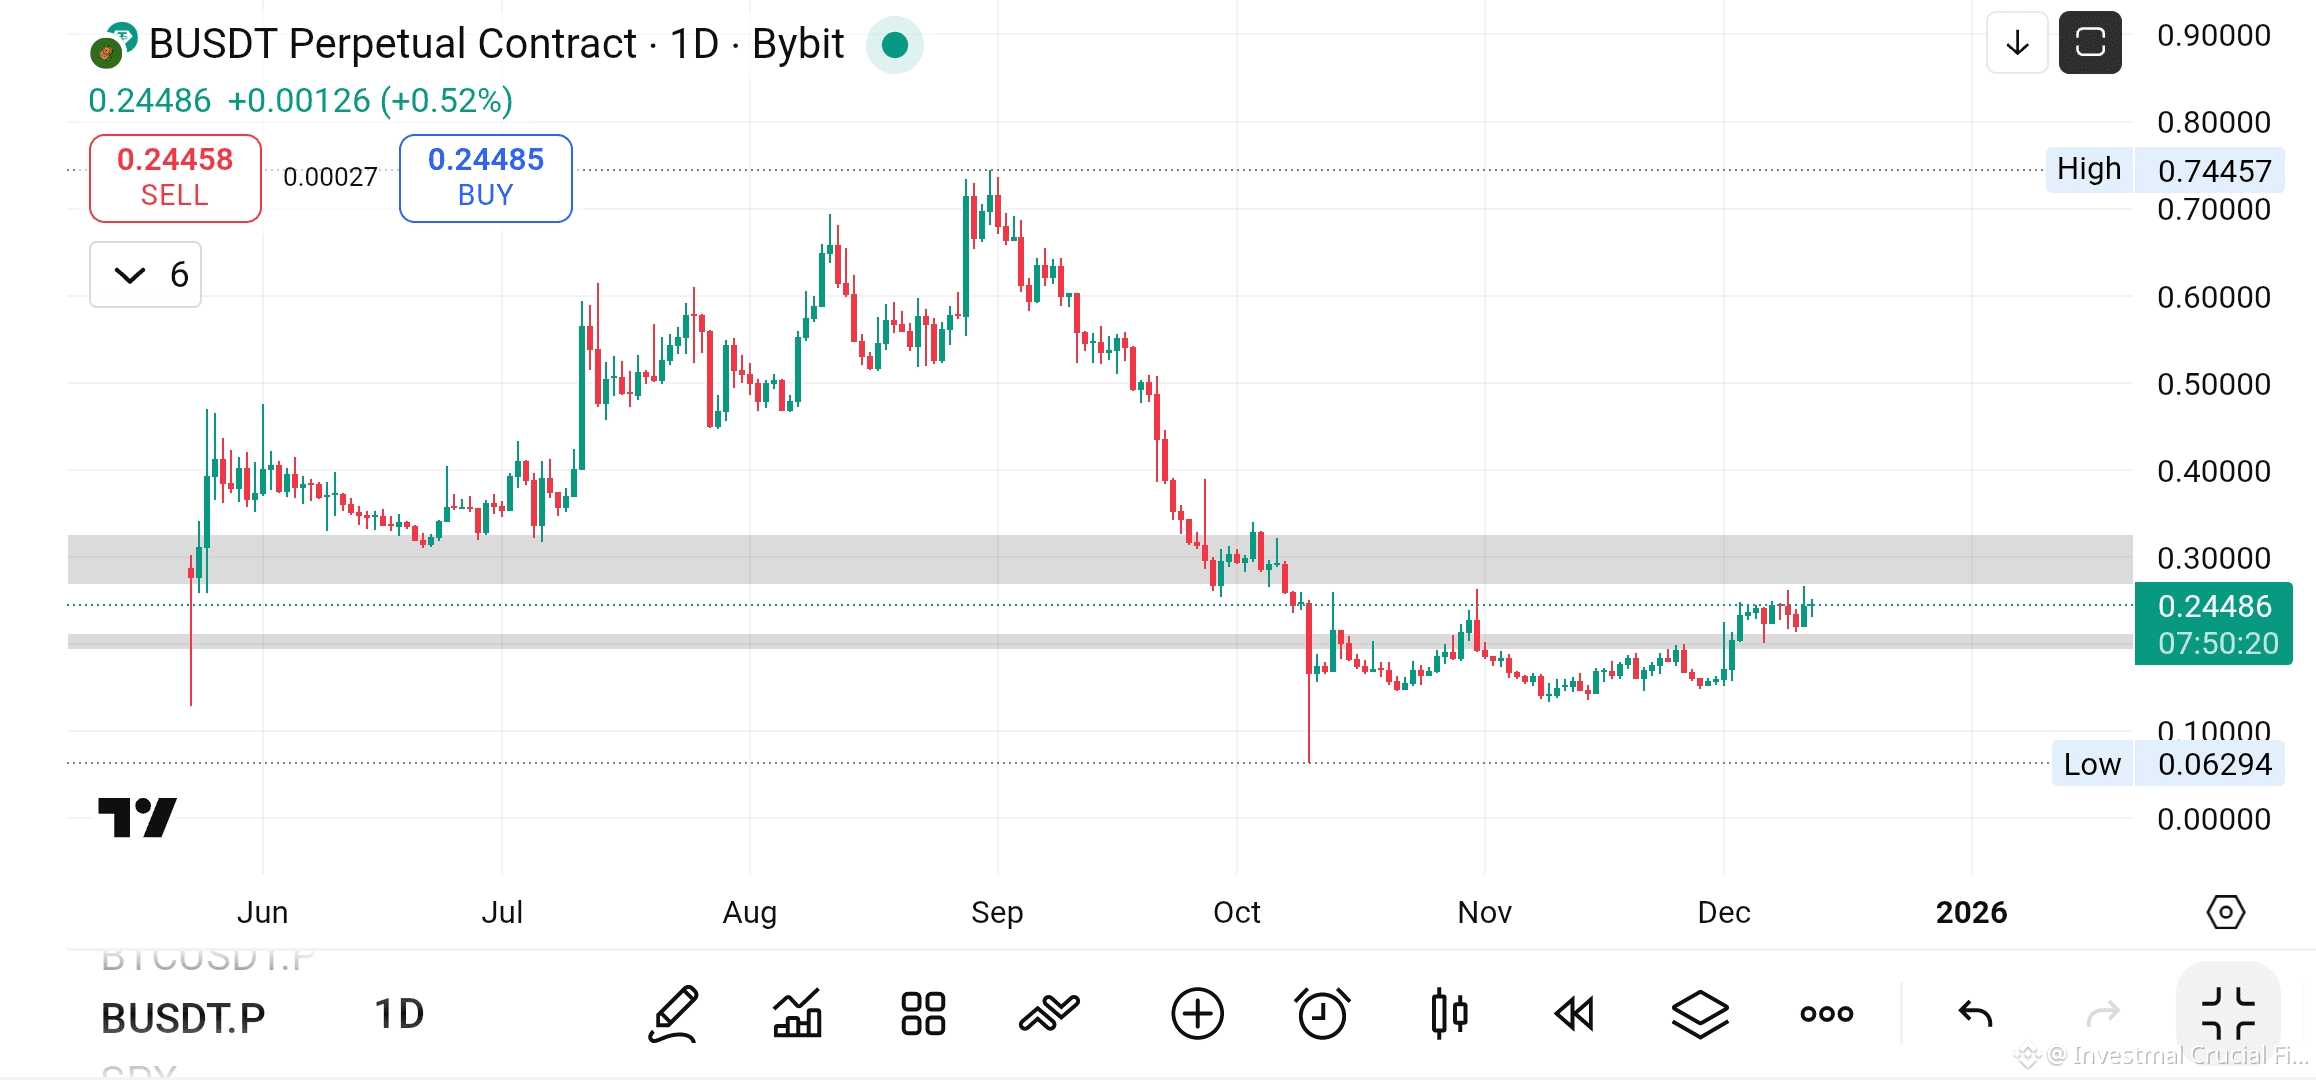
The current price is around 0.2426, which is above the last swing low at 0.1340 and below the last swing high (still forming, so no clear breakout yet).
The equilibrium point is around 0.2005, meaning the price is trading above equilibrium—an area where manipulation or distribution can occur.
The daily trend is slightly bearish, but there are bullish strength signals, as the price has been ranging and accumulating for a while.
Technical indicators are mixed, but buyers have moderate control based on MACD, Vortex, Momentum, PSAR, DMI, Fisher, while there is some bearish pressure on RSI, Stochastic, and MFI.
📉 Indicator Data:
MACD: Bullish
Stochastic: Bearish
Vortex: Bullish
Momentum: Bullish
RSI: Bearish
PSAR: Bullish
DMI: Bullish
MFI: Bearish
Fisher: Bullish
ADX: Rising (strong trend)
📈 Key Chart Levels
0.2634: Major resistance near the current price (strong supply zone)
0.2444: Secondary resistance
0.2012: Strong support above equilibrium; breaking it could push price lower
0.1815: Next support
0.1419: Main support near the previous swing low
0.1340: The lowest low of the recent move—likely liquidity area where big players hunt stops before a reversal
0.2803: Advanced resistance if the near levels get broken
📌 Possible Trading Opportunities
If the price breaks 0.2634 with a strong daily close and high volume, a continuation upward is likely toward 0.2800 and then 0.3460.
If you see a bearish reversal candle (like a Pin Bar or Bearish Engulfing) around 0.2634 or 0.2444, with weakening momentum on lower timeframes (4H), a correction may occur toward 0.2012 or 0.1815.
If price returns and breaks below 0.2012 and fails to reclaim it, expect further downside toward 0.1419, or even a liquidity sweep down to 0.1340.
🌌 My Expectation
For now, price is showing consolidation and accumulation above equilibrium.
A breakout above 0.2634 is possible if stronger bullish confirmations appear on lower timeframes (like a bullish reversal candle or SMC Break of Structure).
If 0.2634 breaks with a strong daily candle and high volume, a long position could be taken, with target 1 at 0.2800 and target 2 around 0.3460.
Stop-loss below the nearest swing low or the reversal candle low on a smaller timeframe.
If the price rejects 0.2634 with a clear bearish reversal candle and weakening volume, confirmed by Stochastic and RSI, then a short position could be taken, targeting 0.2012 then 0.1815, with stop-loss above the recent high.
Always wait for confirmations such as a strong Pin Bar, break of previous structure on 1H/4H, or visible momentum weakness.


