

 When a market spends a long time consolidating inside a fixed range, the battle between liquidity, resistance, and support becomes the key driver. Price keeps rotating — resistance to support, support to resistance — until a decisive breakout finally happens
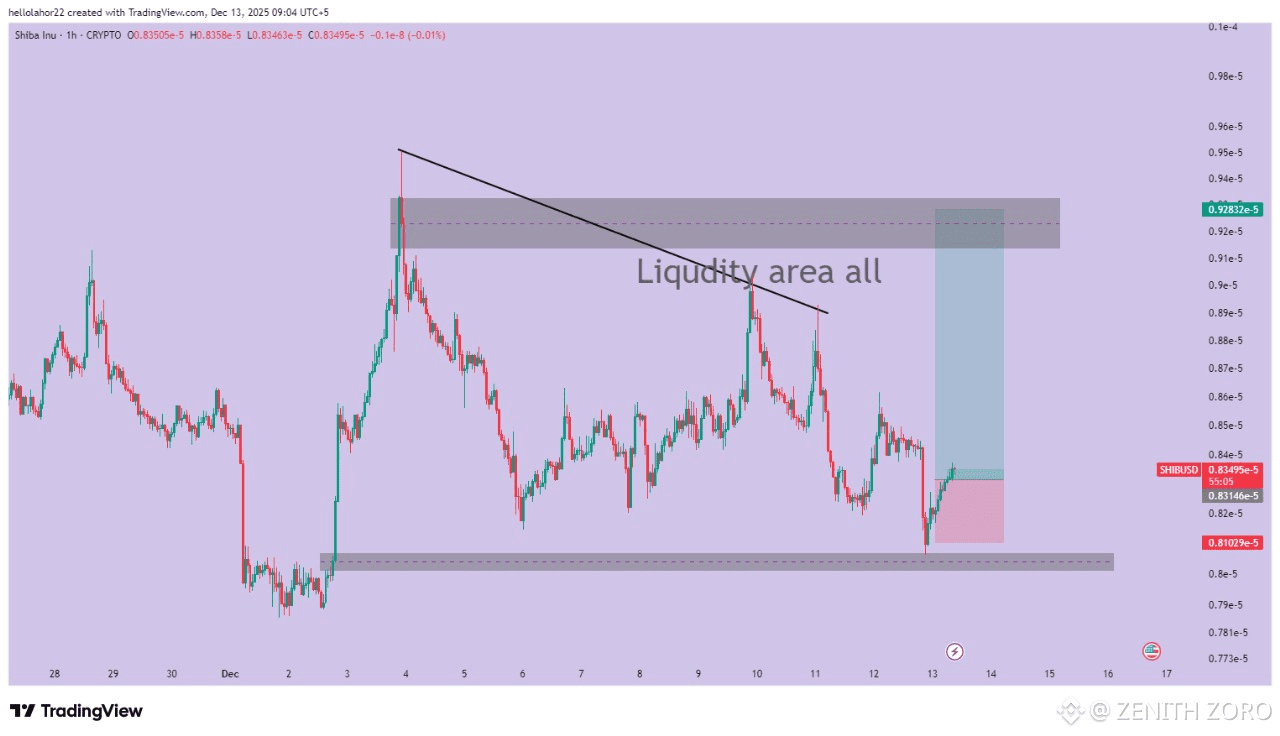
On the H1 timeframe, $SHIB is showing a similar structural behavior.
• Price has tapped the lower liquidity zone multiple times, confirming strong demand.
• Each reaction from this zone has pushed the market back upward with clear momentum.
• A descending trendline from previous swing highs is compressing price — a typical pattern before a breakout.
• The upper block around 0.00000928 – 0.00000935 holds most of the short-term liquidity.
• Once this zone gets challenged, probability favors a breakout toward higher levels
This structure reflects a sequence of higher lows forming against a static resistance, creating tightening pressure before expansion.
Such a setup often precedes a bullish continuation.
The chart suggests that buyers are already participating, and the next major reaction will likely develop when price confronts the liquidity zone above.
H1 Levels to Watch
Entry Zone: 0.00000820 – 0.00000835
TP1: 0.00000870
TP2: 0.00000905
TP3: 0.00000928+ (liquidity expansion target)
Risk-averse traders may choose spot or low leverage.
This remains a high-probability breakout setup as long as structural support holds.
Namaste.
✅ Trade SHIB with discipline.
