Bitcoin chart forecast
From the daily chart, Bitcoin seems to be dancing in its comfort range from $88,000 to $96,000 after a sharp rejection around $94,000.
The price is cooling off from a peak of $107,465 and retreating into sideways movement. This type of market uncertainty smells like consolidation, especially with volumes decreasing after a spike near the bottom at $80,537 — a clear sign that big players bought the dip.
However, without new buying pressure, Bitcoin risks returning to its previous support levels.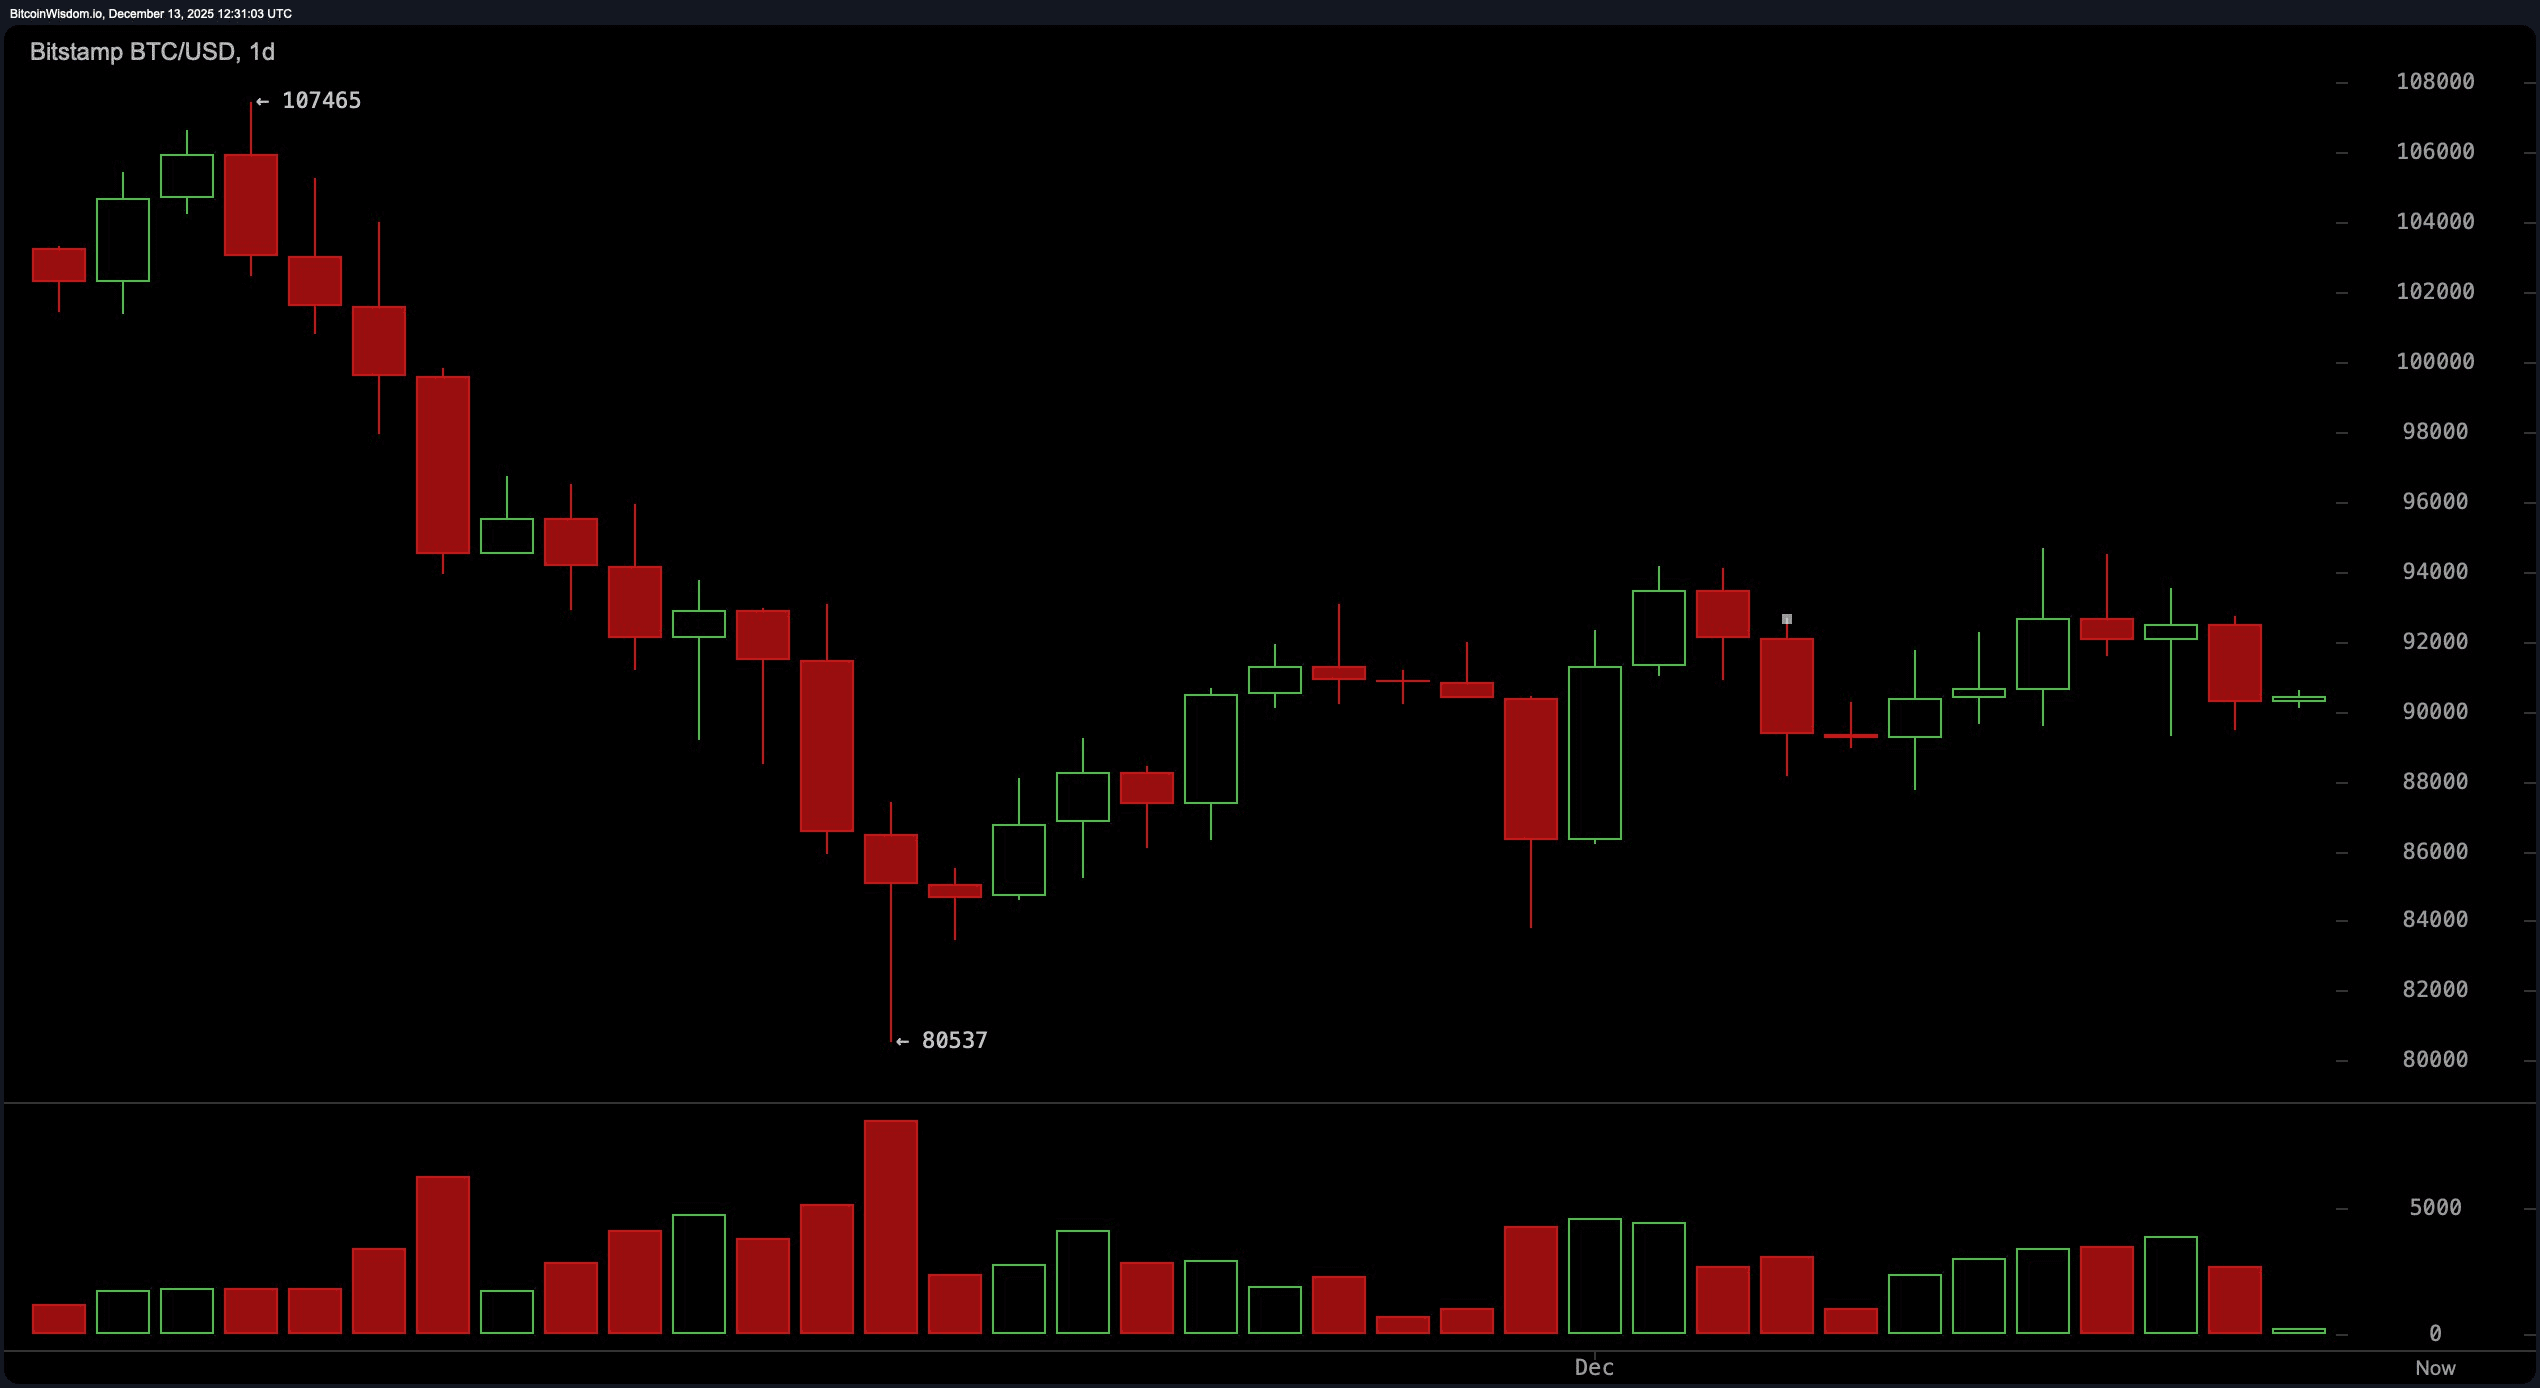
==========
With an increase on the 4-hour chart, the picture becomes more volatile.
Recently, Bitcoin fell from $92,500 to $89,000 in one red candle movement on high volumes. It is now balancing around $90,500 with the grace of a tired swimmer.
A few doji candles signal uncertainty, and the narrowing volume sets the stage for compression.
A breakout above $92,500 — provided that volumes do not take a vacation — could open a short-term path upward.
But if Bitcoin reaches the peak at $94,500 twice, this rejection may become noticeable.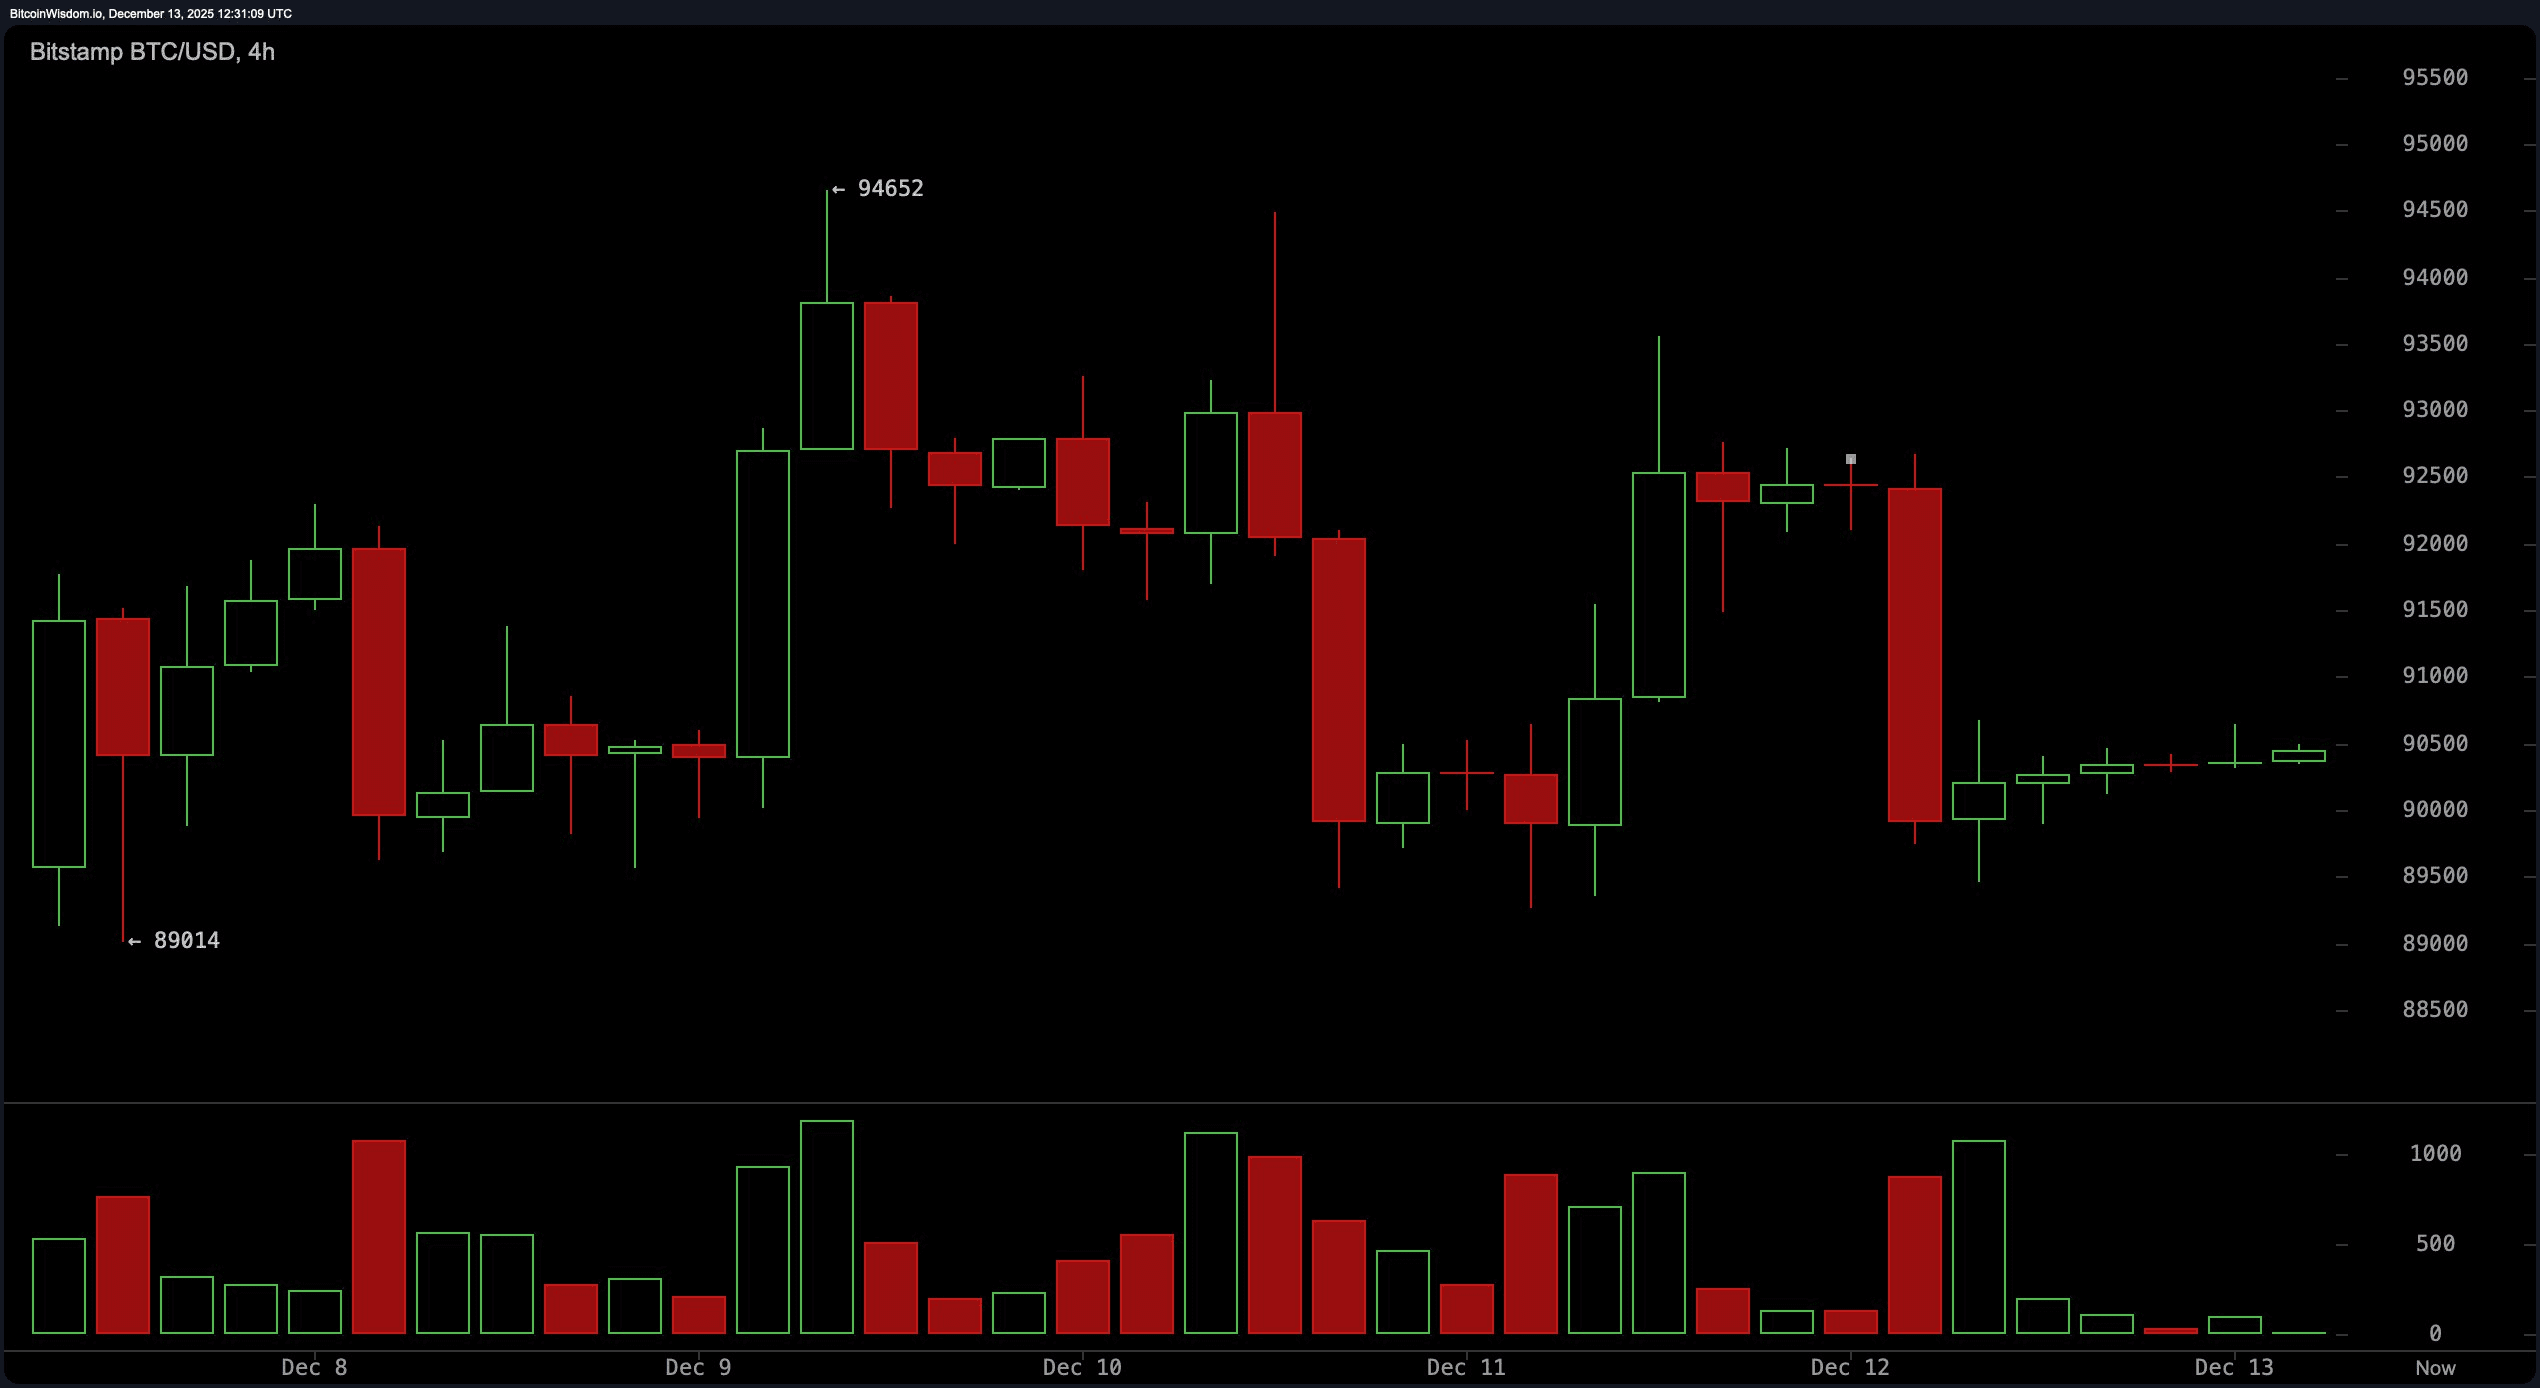
==========
The 1-hour chart doesn't offer much help if you're looking for certainty. All candles are compressed, and traders are evaluating the market cautiously, reflecting a market stuck in a paralysis of decisions.
The price structure is compressing just above $90,000, which almost always precedes an expansion — in one direction or another.
If it enthusiastically surpasses the mark of $91,000, the level of $92,500 could quickly appear.
If not, a drop below $89,000 could bring us back to the $88,000 level with almost no fanfare.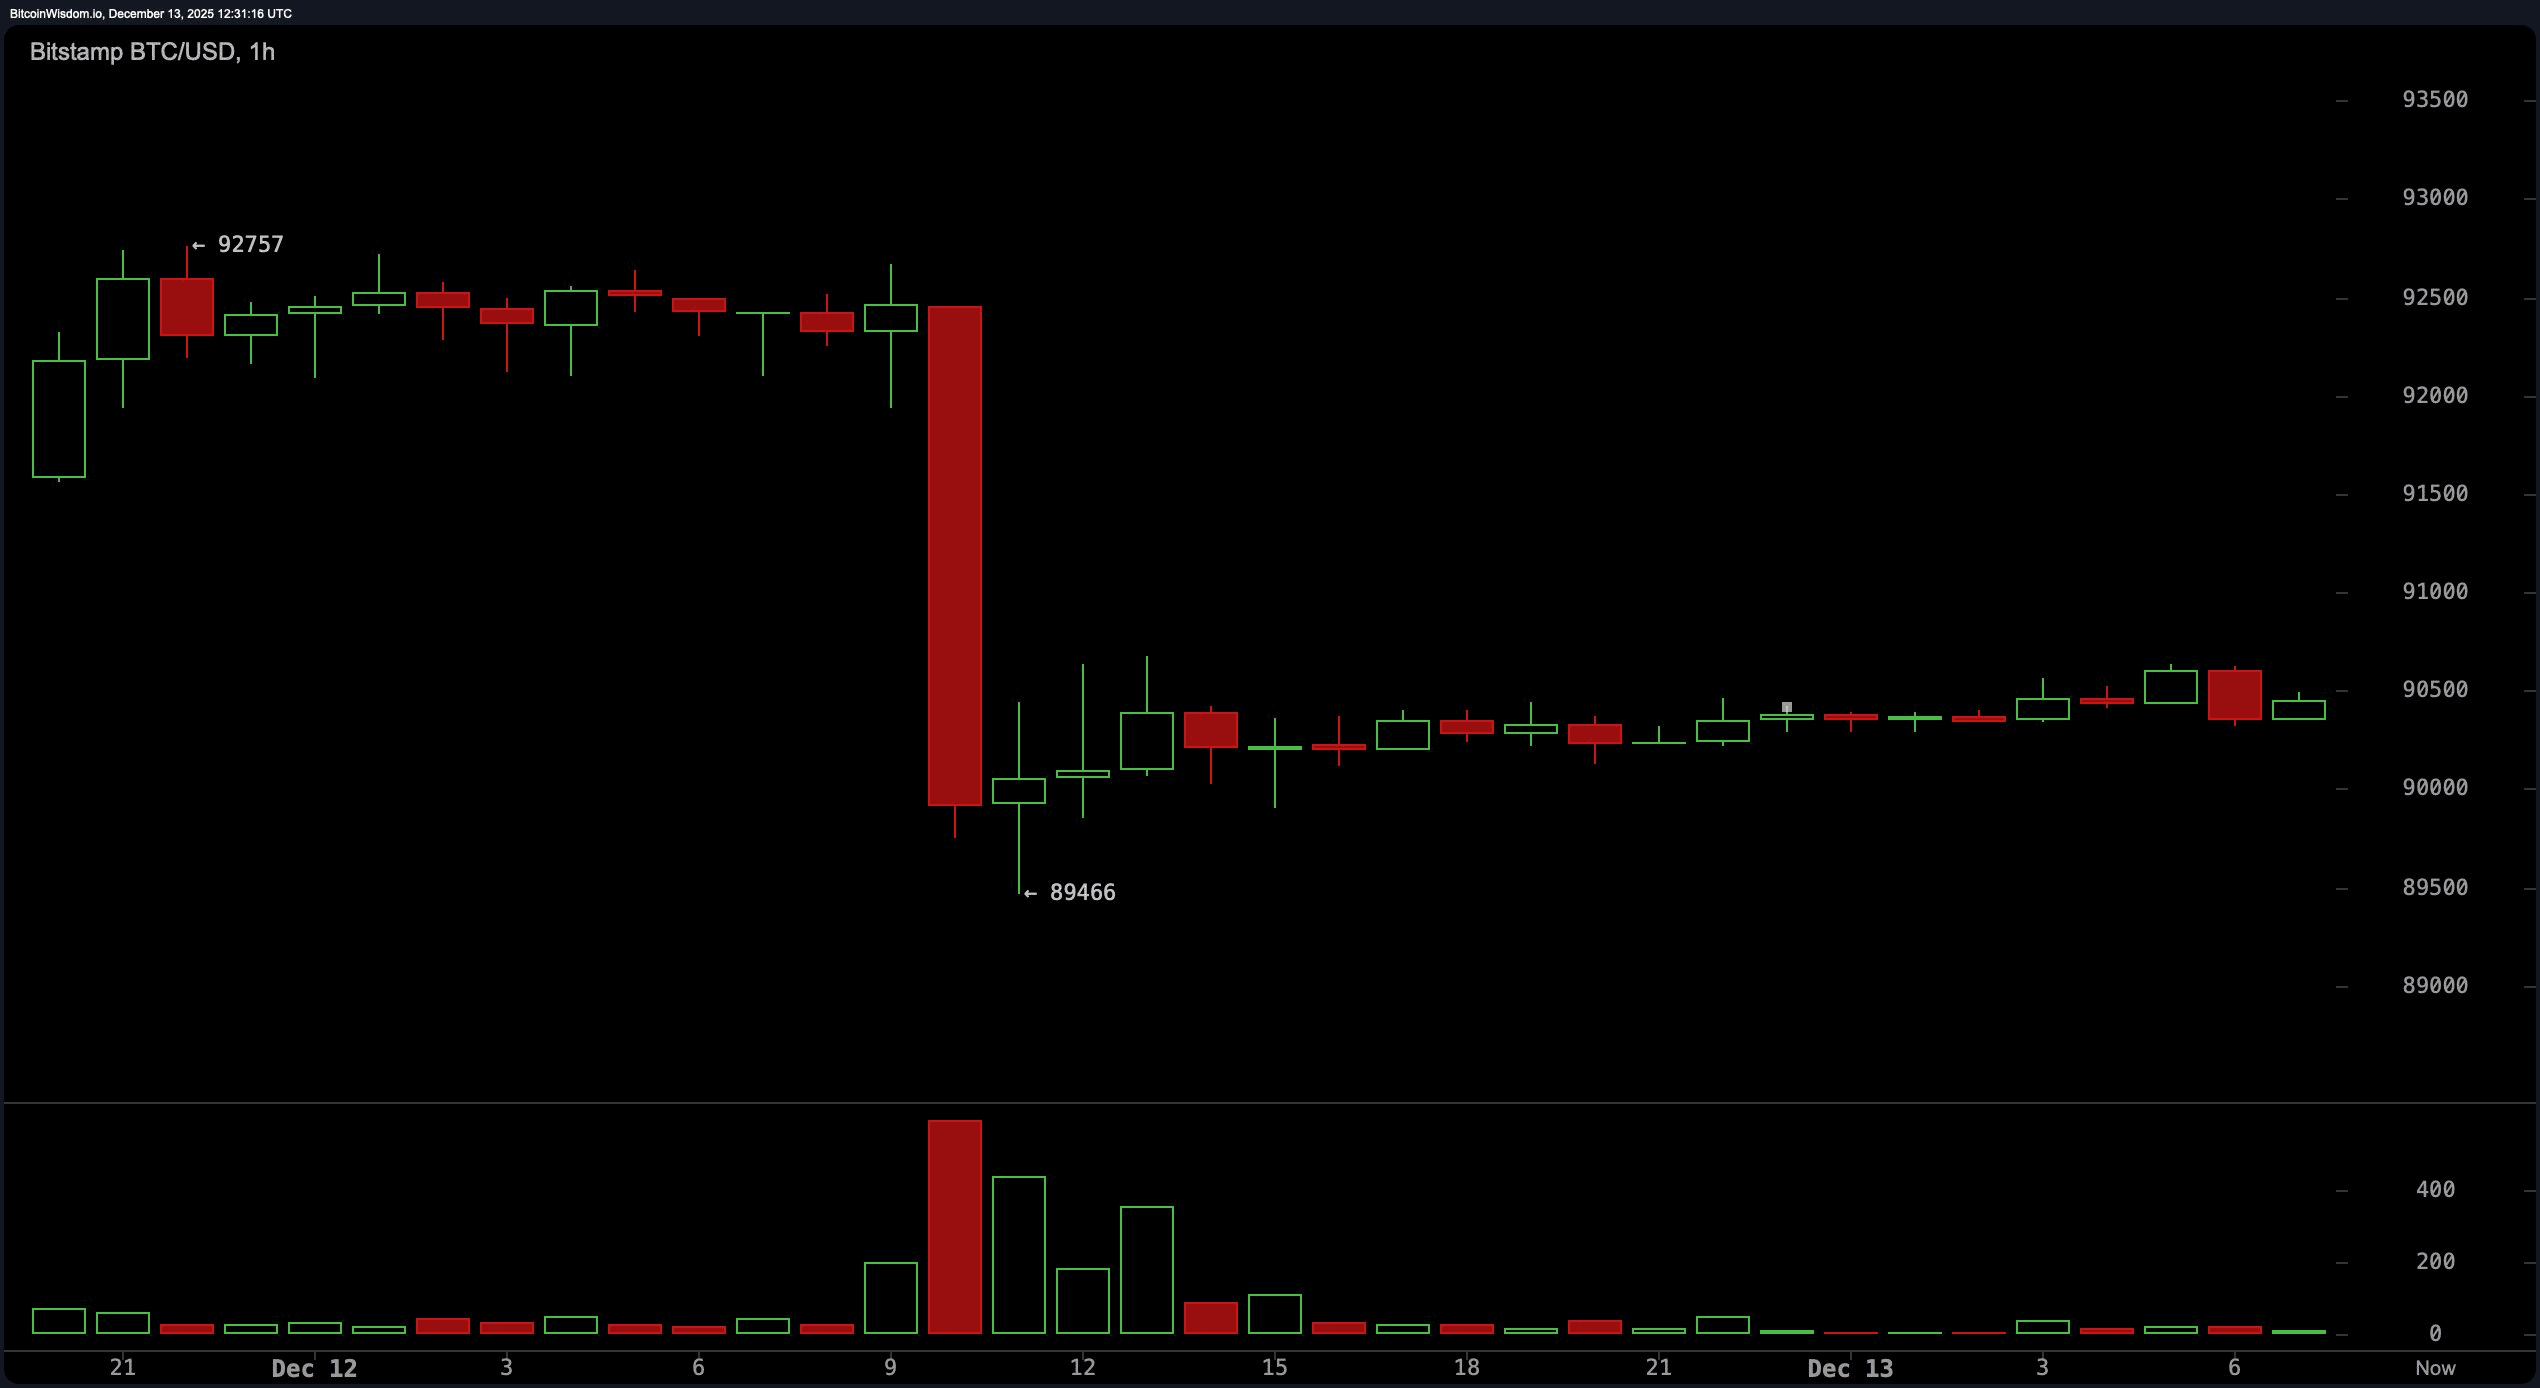
==========
Bulls' verdict:
If Bitcoin holds positions above $90,000 and volumes support a breakout above $91,000–$92,500, momentum may shift upward to the resistance zone of $94,000–$96,000.
Watch for confirmed movement supported by rising volumes and a strengthening MACD — the only oscillator currently flashing optimism.
========
Bears' verdict:
If Bitcoin loses positions below $89,000 with increasing sell volumes, the next stop could be $88,000 — and possibly a retest of support at $80,500 if bearish momentum strengthens.
With all major moving averages tilted against the price and a decline in momentum, the downward path offers less resistance than the bulls would like to admit.
