
If you want to read the minds of Whales, do not look at minute by minute price fluctuations. Look at their inventory. The Exchange Net Position Change metric measures the net amount of Bitcoin deposited to or withdrawn from exchange wallets over the last 30 days. This is the most accurate gauge of Supply and Demand mechanics.
🔸 Unlike price candles Green is good, Red is bad, in this indicator, the meaning is often reversed:
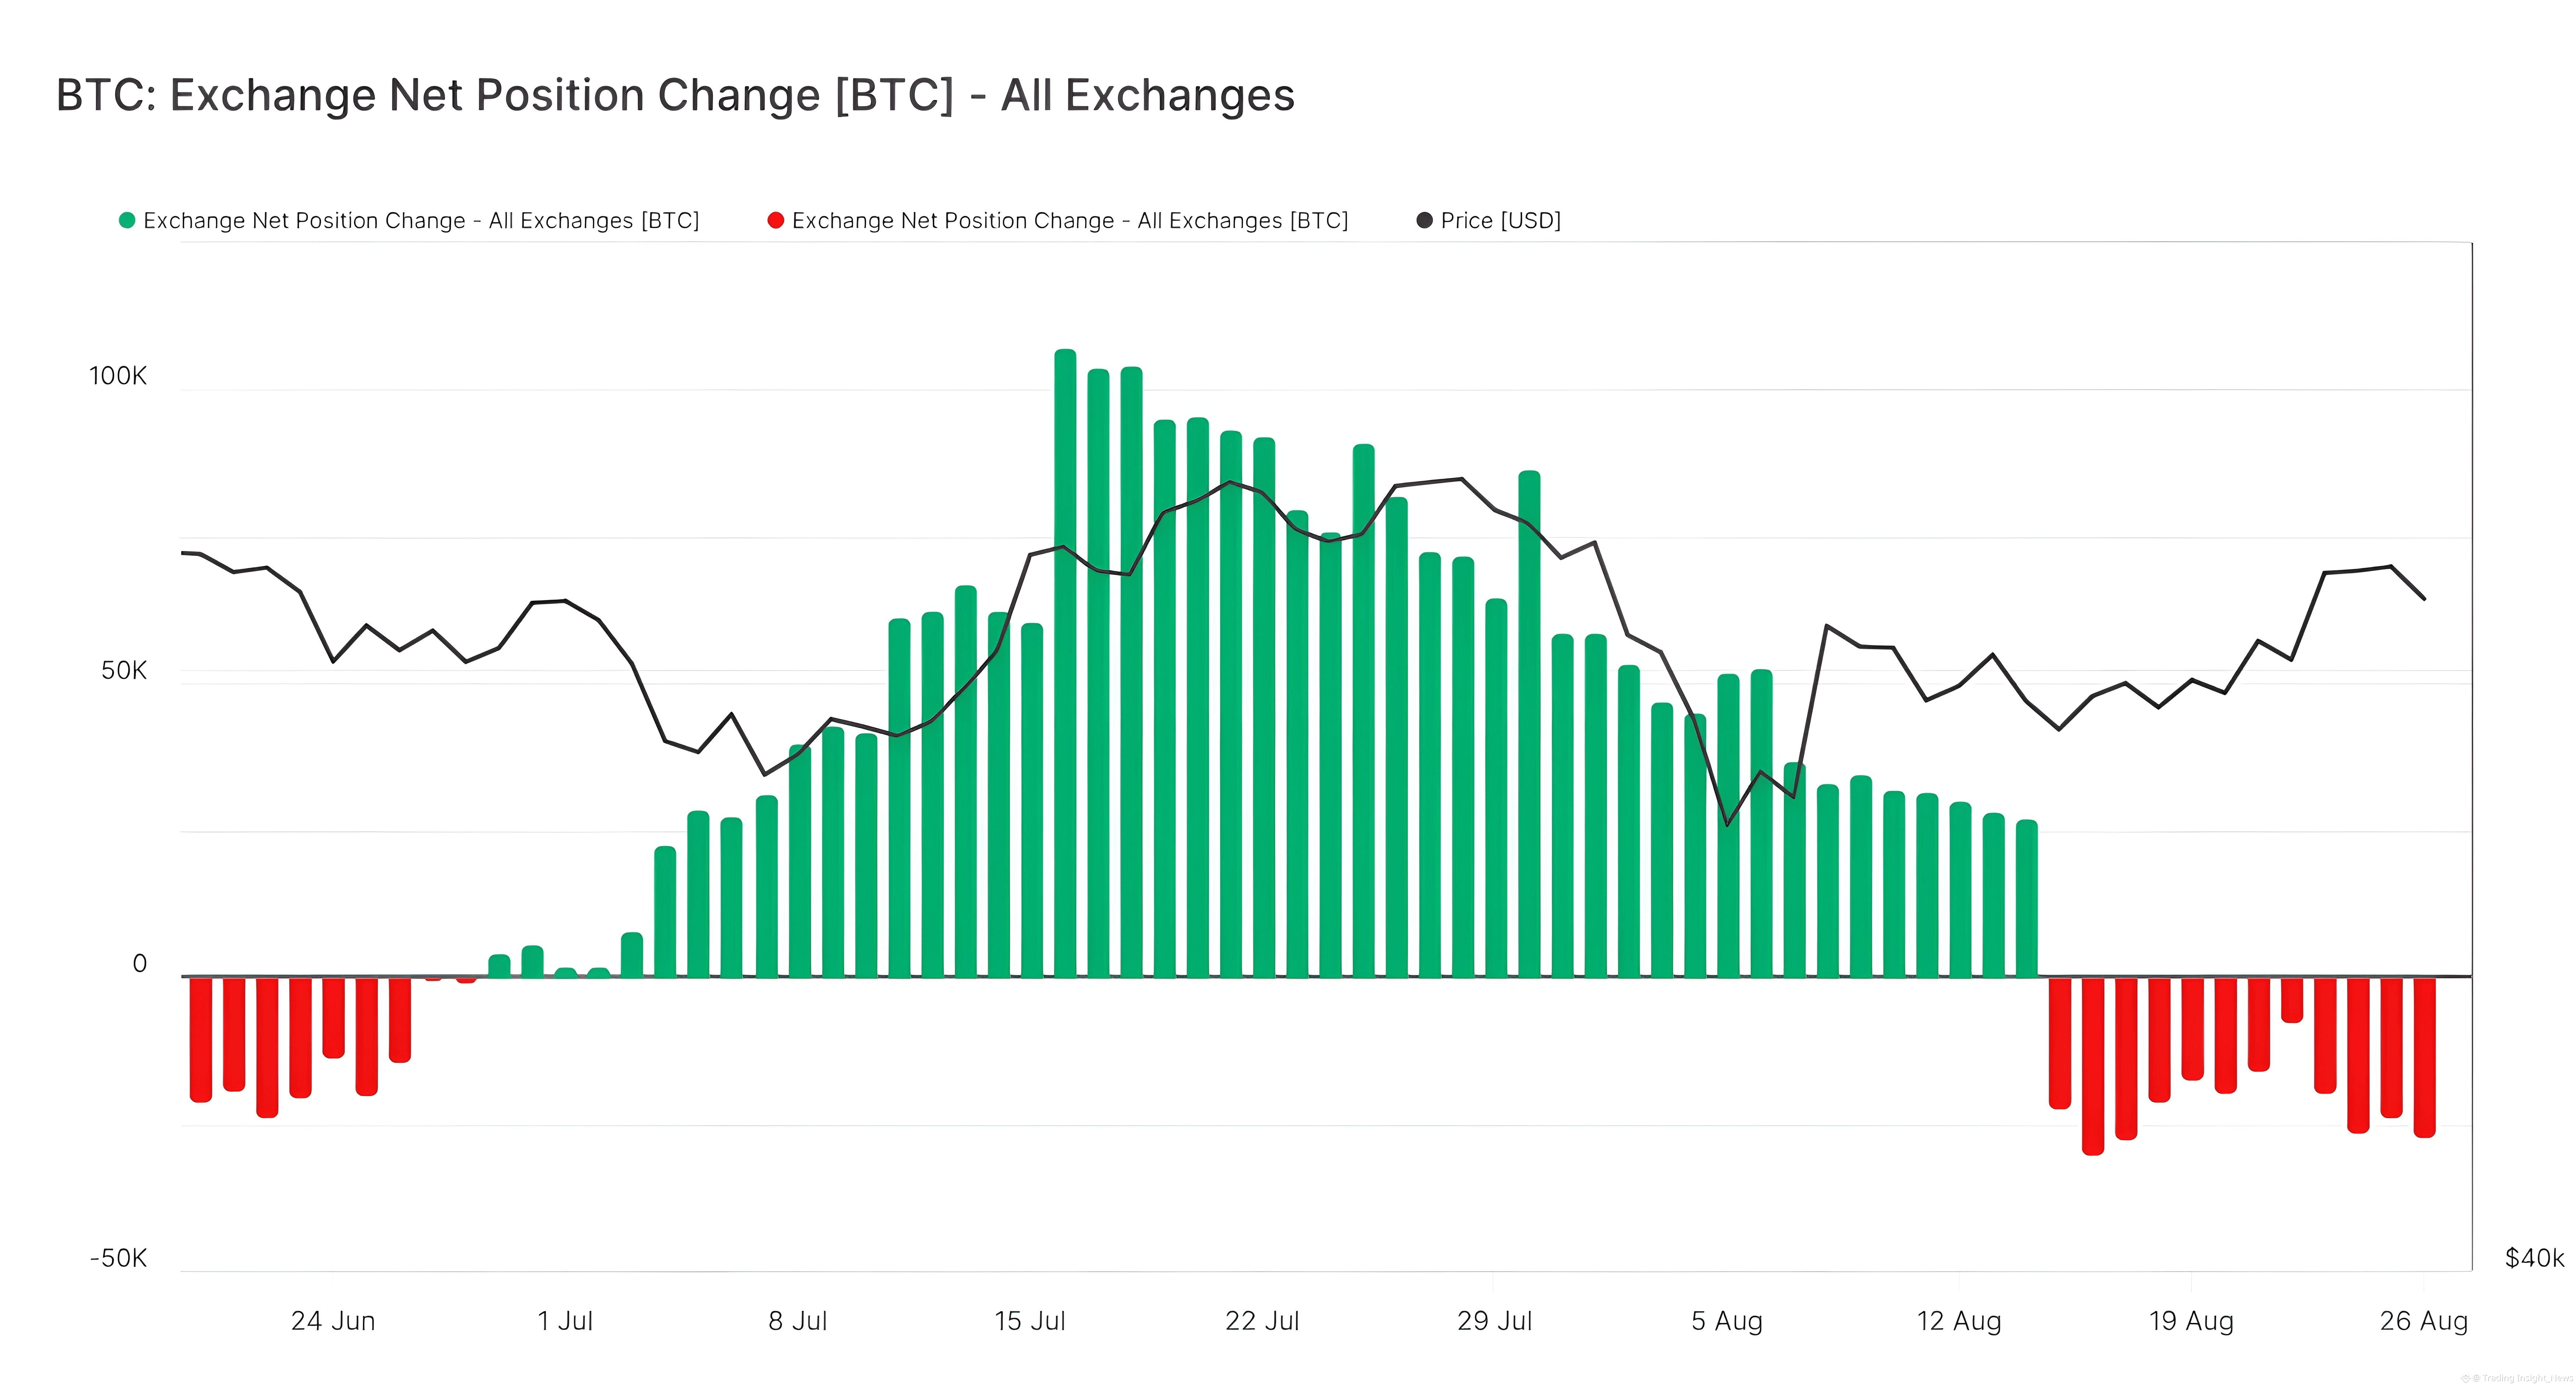
When red bars appear below the zero line, it means Bitcoin is being withdrawn from exchanges to cold storage.
👉Floating supply is drying up. Whales are in the Accumulation phase and have no intention of selling at current prices. This is a long term Bullish signal.
When tall green bars appear, it means Bitcoin is flooding onto exchanges.
👉Whales are moving inventory from the warehouse to the market. Potential Sell Pressure is rising. This signals a Distribution phase or preparation for a dump.
🔸 Price rarely moves instantly when money flows. It takes time to absorb.
History shows that the strongest Parabolic Runs often occur AFTER a sustained 3 to 6 month period of continuous net outflows.
When exchange supply is drained to a critical level, even a small amount of buying pressure can send prices skyrocketing.
🔹 Combine Price Action with Flow:
Price Up + Exchange Supply Down = Sustainable Rally.
Price Up + Exchange Supply Up = Dangerous Rally.
Next time you see Bitcoin price pump hard, will you remember to check if the exchange inventory is draining or filling up? Or will you FOMO buy exactly when Whales are depositing to dump?
News is for reference, not investment advice. Please read carefully before making a decision.
