🔍 Market Structure Overview
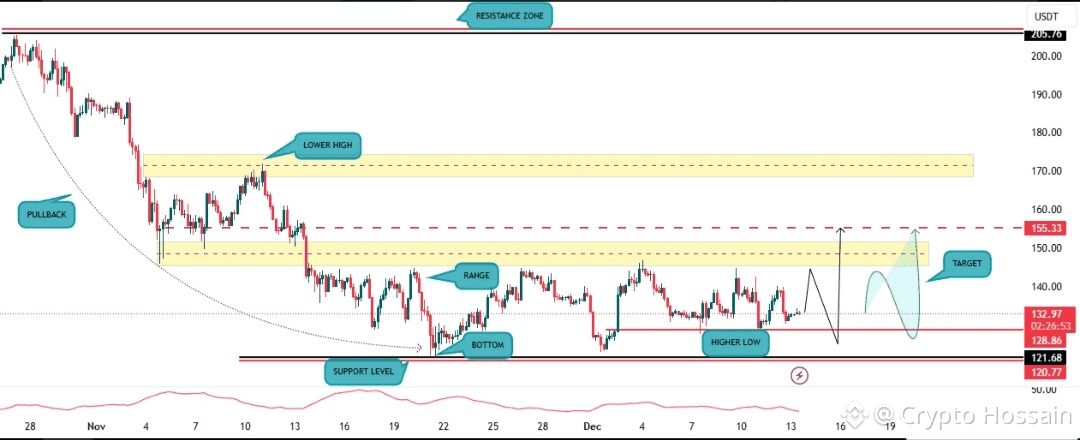
The chart shows SOL/USDT transitioning from a strong bearish trend into a sideways accumulation range, with early signs of a potential bullish reversal.
📉 Higher Timeframe Trend
The market previously formed a clear downtrend (lower highs & lower lows).
Price aggressively sold off from the $200+ resistance zone, confirming strong seller dominance.
Momentum slowed after reaching the major support zone near $121–125, signaling seller exhaustion.
🧊 Trend status: Bearish → Neutral (Transition Phase)
🧱 Key Support & Resistance Zones
🟥 Major Resistance:
$170–175 zone → Previous supply area & lower-high region
$155.33 → Range top / breakout trigger
🟩 Major Support:
$121.68 – $120.77 → Strong demand zone (range bottom)
Buyers defended this zone multiple times, forming a base
🔁 Range & Accumulation Behavior
Price is currently trading inside a well-defined range:
Range Low: ~$121
Range High: ~$155
Multiple failed breakdowns below support suggest smart money accumulation.
Formation of a Higher Low indicates bullish structural improvement 📈
🧠 Price Action Signals
✔️ Higher Low formed
✔️ Range compression (volatility contraction)
✔️ Bearish momentum weakening
❗ Still below major resistance → confirmation needed
🎯 Projected Scenarios
🟢 Bullish Scenario (Preferred):
Clean breakout above $155.33
Retest & continuation toward $170–175 target zone
Confirms range breakout → trend reversal
🔴 Bearish Scenario (Risk):
Failure at resistance
Breakdown below $121
Opens downside continuation (invalidates bullish setup)
📌 Trading Insight
📘 This is a classic accumulation-to-expansion setup.
Patience is key — wait for confirmation, not prediction.
⚡ Conclusion
SOL is no longer in free fall and is showing early bullish intent. A breakout above resistance could trigger a strong recovery rally, while support remains the critical invalidation level.
📣 Bias: Neutral → Bullish (on confirmation)
📆 Timeframe: Swing / Short-term
🛑 Risk Management: Always use stop-loss below range support
✅ Trade here on $SOL