Ethereum continues to trade in a tight range, holding just below the upper boundary of its trend channel, and all signs currently point toward a low-volatility weekend. Based on historical behavior and current market conditions, a major breakout over the weekend appears unlikely.
🔍 Market Context: Why the Weekend May Stay Quiet
Historically, Ethereum (and crypto markets in general) rarely see decisive channel breakouts over weekends, especially when:
Trading volume is already declining
Liquidity is thin toward year-end
Price action lacks impulsive structure on lower timeframes
This environment usually leads to range-bound price action, which is exactly what we are seeing now.
📊 Ethereum Trend Channel & Higher Timeframe Outlook
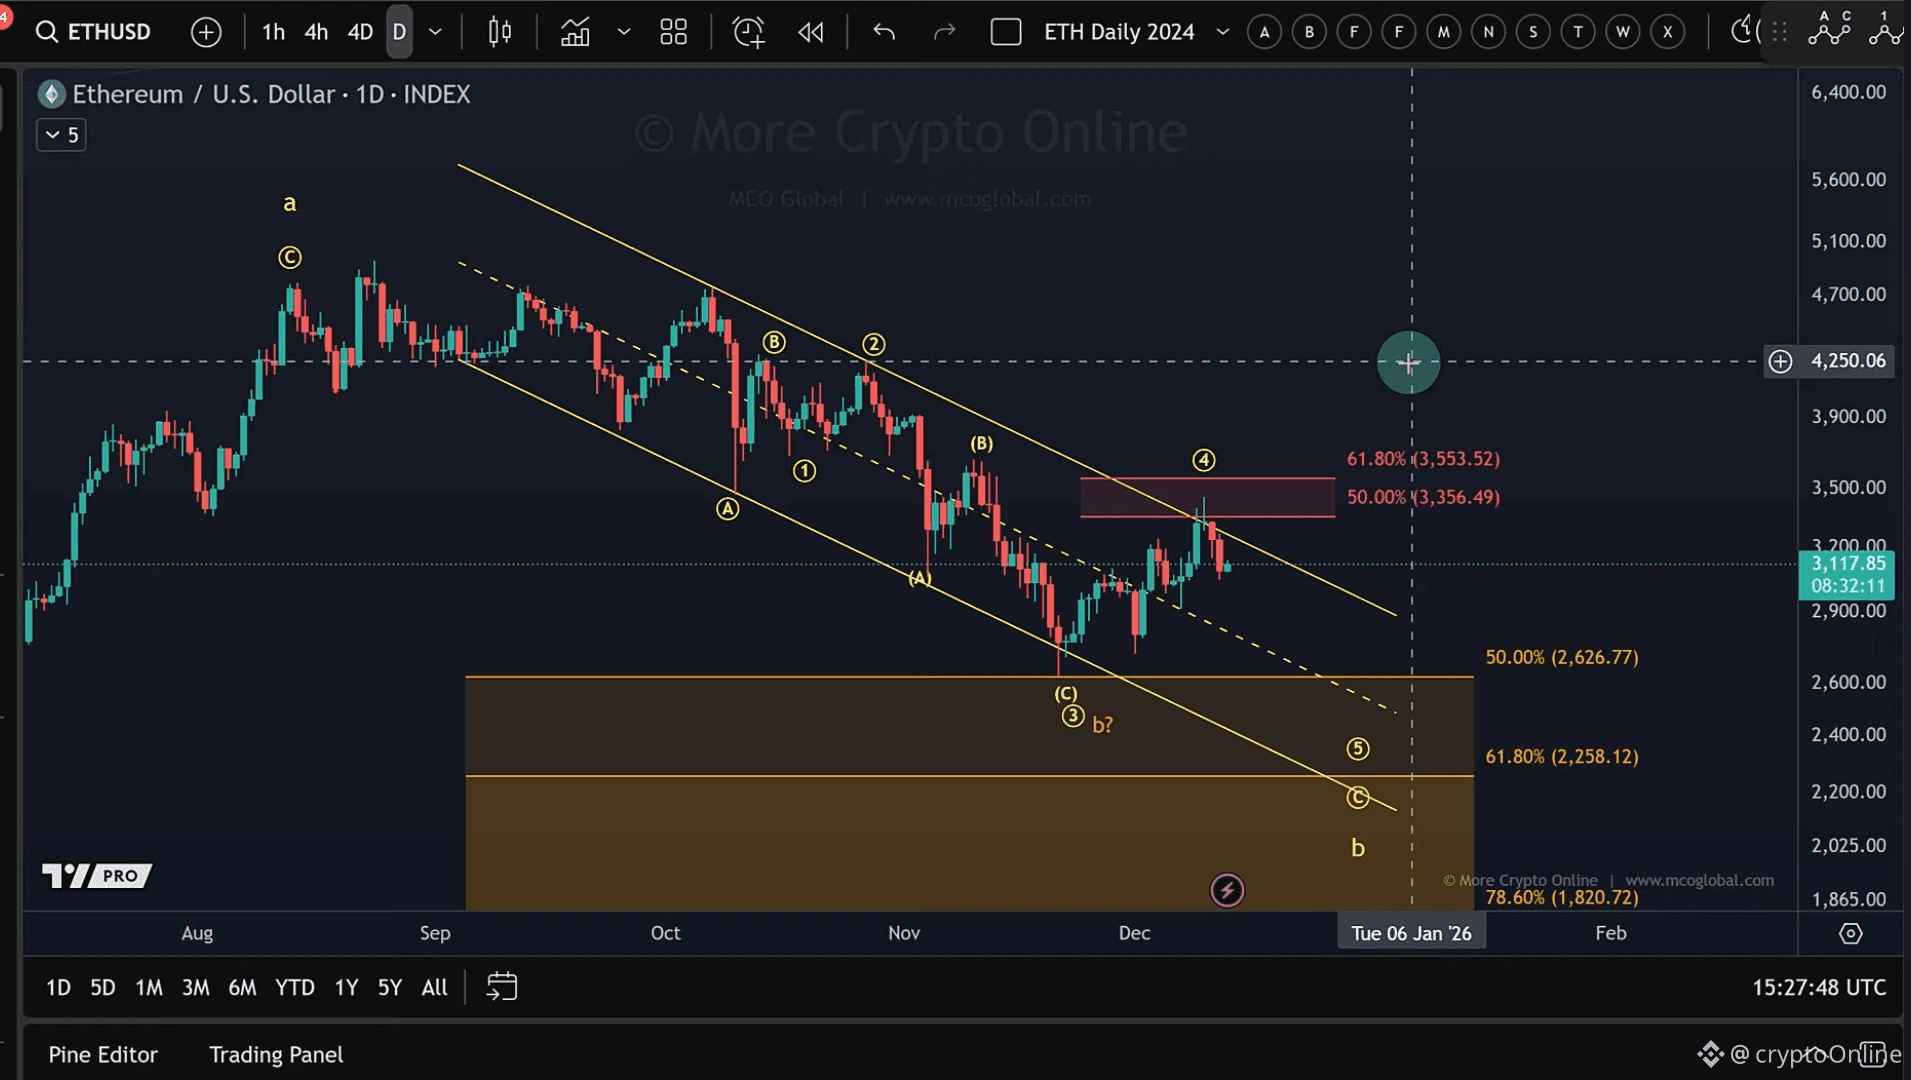
$ETH remains below the upper boundary of its trend channel, while price is still holding above the channel’s center line, currently around $2,800–$2,810.
A clear break below this center line would significantly increase the probability that Ethereum is heading toward the next downside target zone.
🔽 Potential Downside Target (Wave 5 Scenario):
$2,626 – $2,258
At this stage, there is not enough evidence to confirm a market top, but there are early warning signs suggesting that the corrective structure may already be complete.
🌊 Elliott Wave Perspective: Two Scenarios in Play
Ethereum currently presents two valid scenarios:
🟡 Scenario 1 (Yellow Count – Bearish Continuation)
The corrective wave 4 likely ended at the November 21 low
$ETH is now potentially starting a wave 5 impulse to the downside
This move would likely unfold as a five-wave structure lower
This scenario gains confirmation below $2,800.
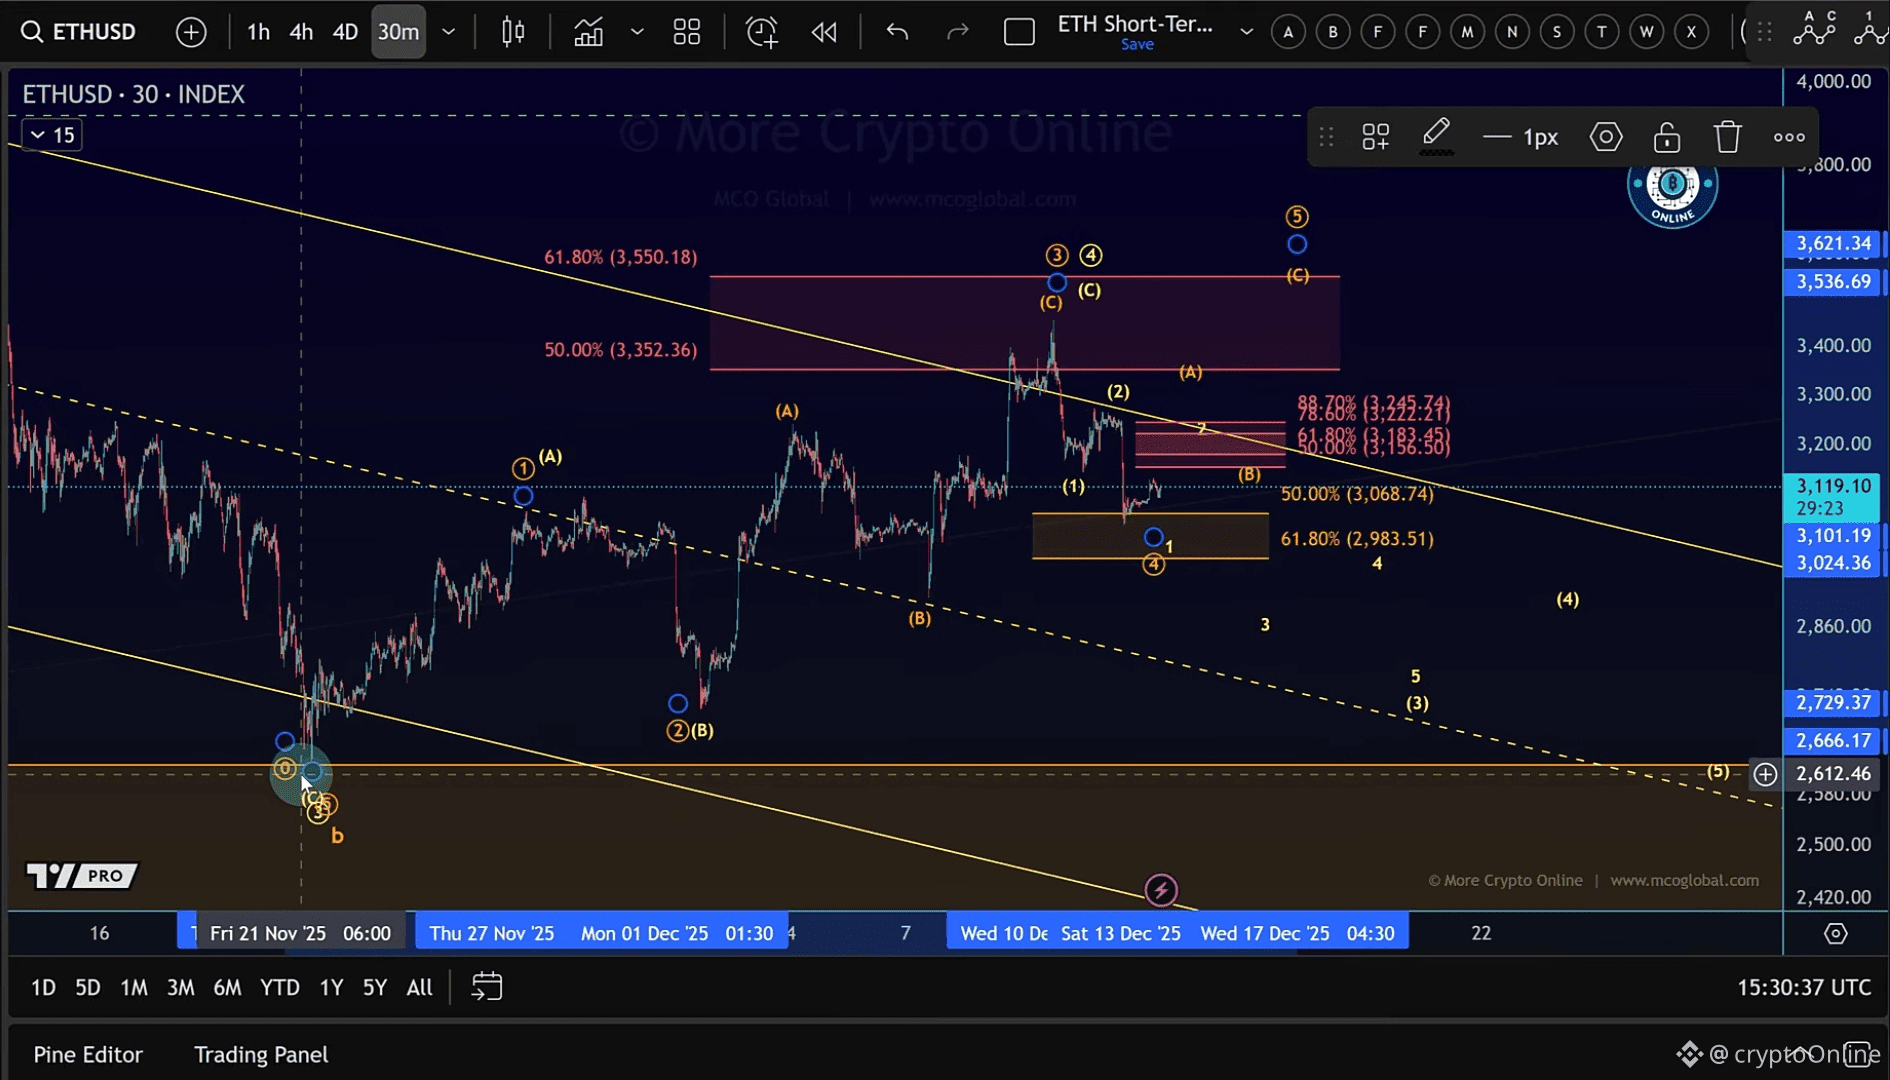
🔵 Alternative Scenario (Bullish Diagonal Potential)
The November 21 low may already be a meaningful bottom
A developing diagonal pattern could be forming
Confirmation requires a break above $3,245
While this diagonal is not ideal in structure, it would still be taken seriously if confirmed.
⏱ Short-Term Weekend Range: Key Support & Resistance
Ethereum is currently respecting the expected weekend range, which is common during periods of low volume.
🟢 Weekend Support:
$2,983 – $3,068
Price has already bounced from this area
🔴 Weekend Resistance:
$3,156 – $3,245
Aligns with the upper boundary of the trend channel
This price action likely represents a corrective bounce (wave 2) within a broader bearish structure, rather than the start of a new impulsive move.
A potential increase in volatility could occur late Sunday, but until then, range trading remains the higher-probability outcome.
