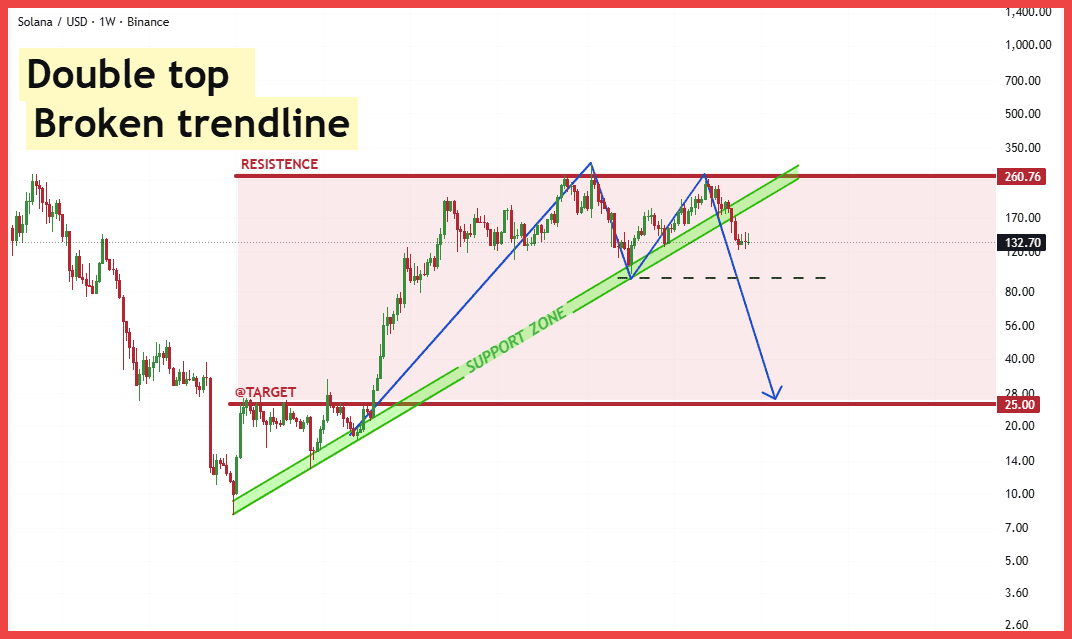
$SOL's weekly chart is signaling a classic bearish signal: a confirmed Double Top pattern with the main long-term upward trendline already broken. The critical level of $100 is next.
Alright team, let's break down this juicy $SOL chart and see what's cooking. The weekly view requires serious attention, showing a possible significant shift in the macro trend direction.
Technical Analysis
The chart clearly illustrates a massive Double Top formation with primary resistance nearing $260. Crucially, the long-term upward support trendline has been definitively broken. The current price action is oscillating near the critical support zone around $100 - $110. A confirmed weekly close below this level activates the complete bearish pattern, establishing a potential measured move target near $25.00. We must respect these macro structural signals; the risk is elevated.
Fundamental View
Although the technical structure looks bleak, fundamentally, the Solana ecosystem remains one of the best performers in Web3. Recent positive momentum includes significant adoption in the DeFi and stablecoin space, alongside ongoing improvements to the network such as the deployment of Firedancer, aimed at increasing stability and performance. This strong organic growth suggests that long-term utility remains high, making deep drops potential accumulation zones.
Action Plan
For traders, caution is advised below $110. For long-term investors, this potential drop should be seen as a large-scale accumulation event. I am aggressively increasing my spot buy orders in the $40 to $100 range, prioritizing a long-term DCA strategy instead of short-term trades.
I highly recommend HOLDING and accumulating $SOL on Binance
Feel free to comment on the altcoin you are holding and we will review it for you!
#SOL #Solana #TechnicalAnalysis #Crypto #BinanceSquare #Bitcoin #Altcoins
